Middle School have been finishing off their maths this year with some data handling. We have reminded ourselves about tally charts and pictograms, but spend some time looking at bar charts and learning how to create and read them. Now it was time to make one ourselves!
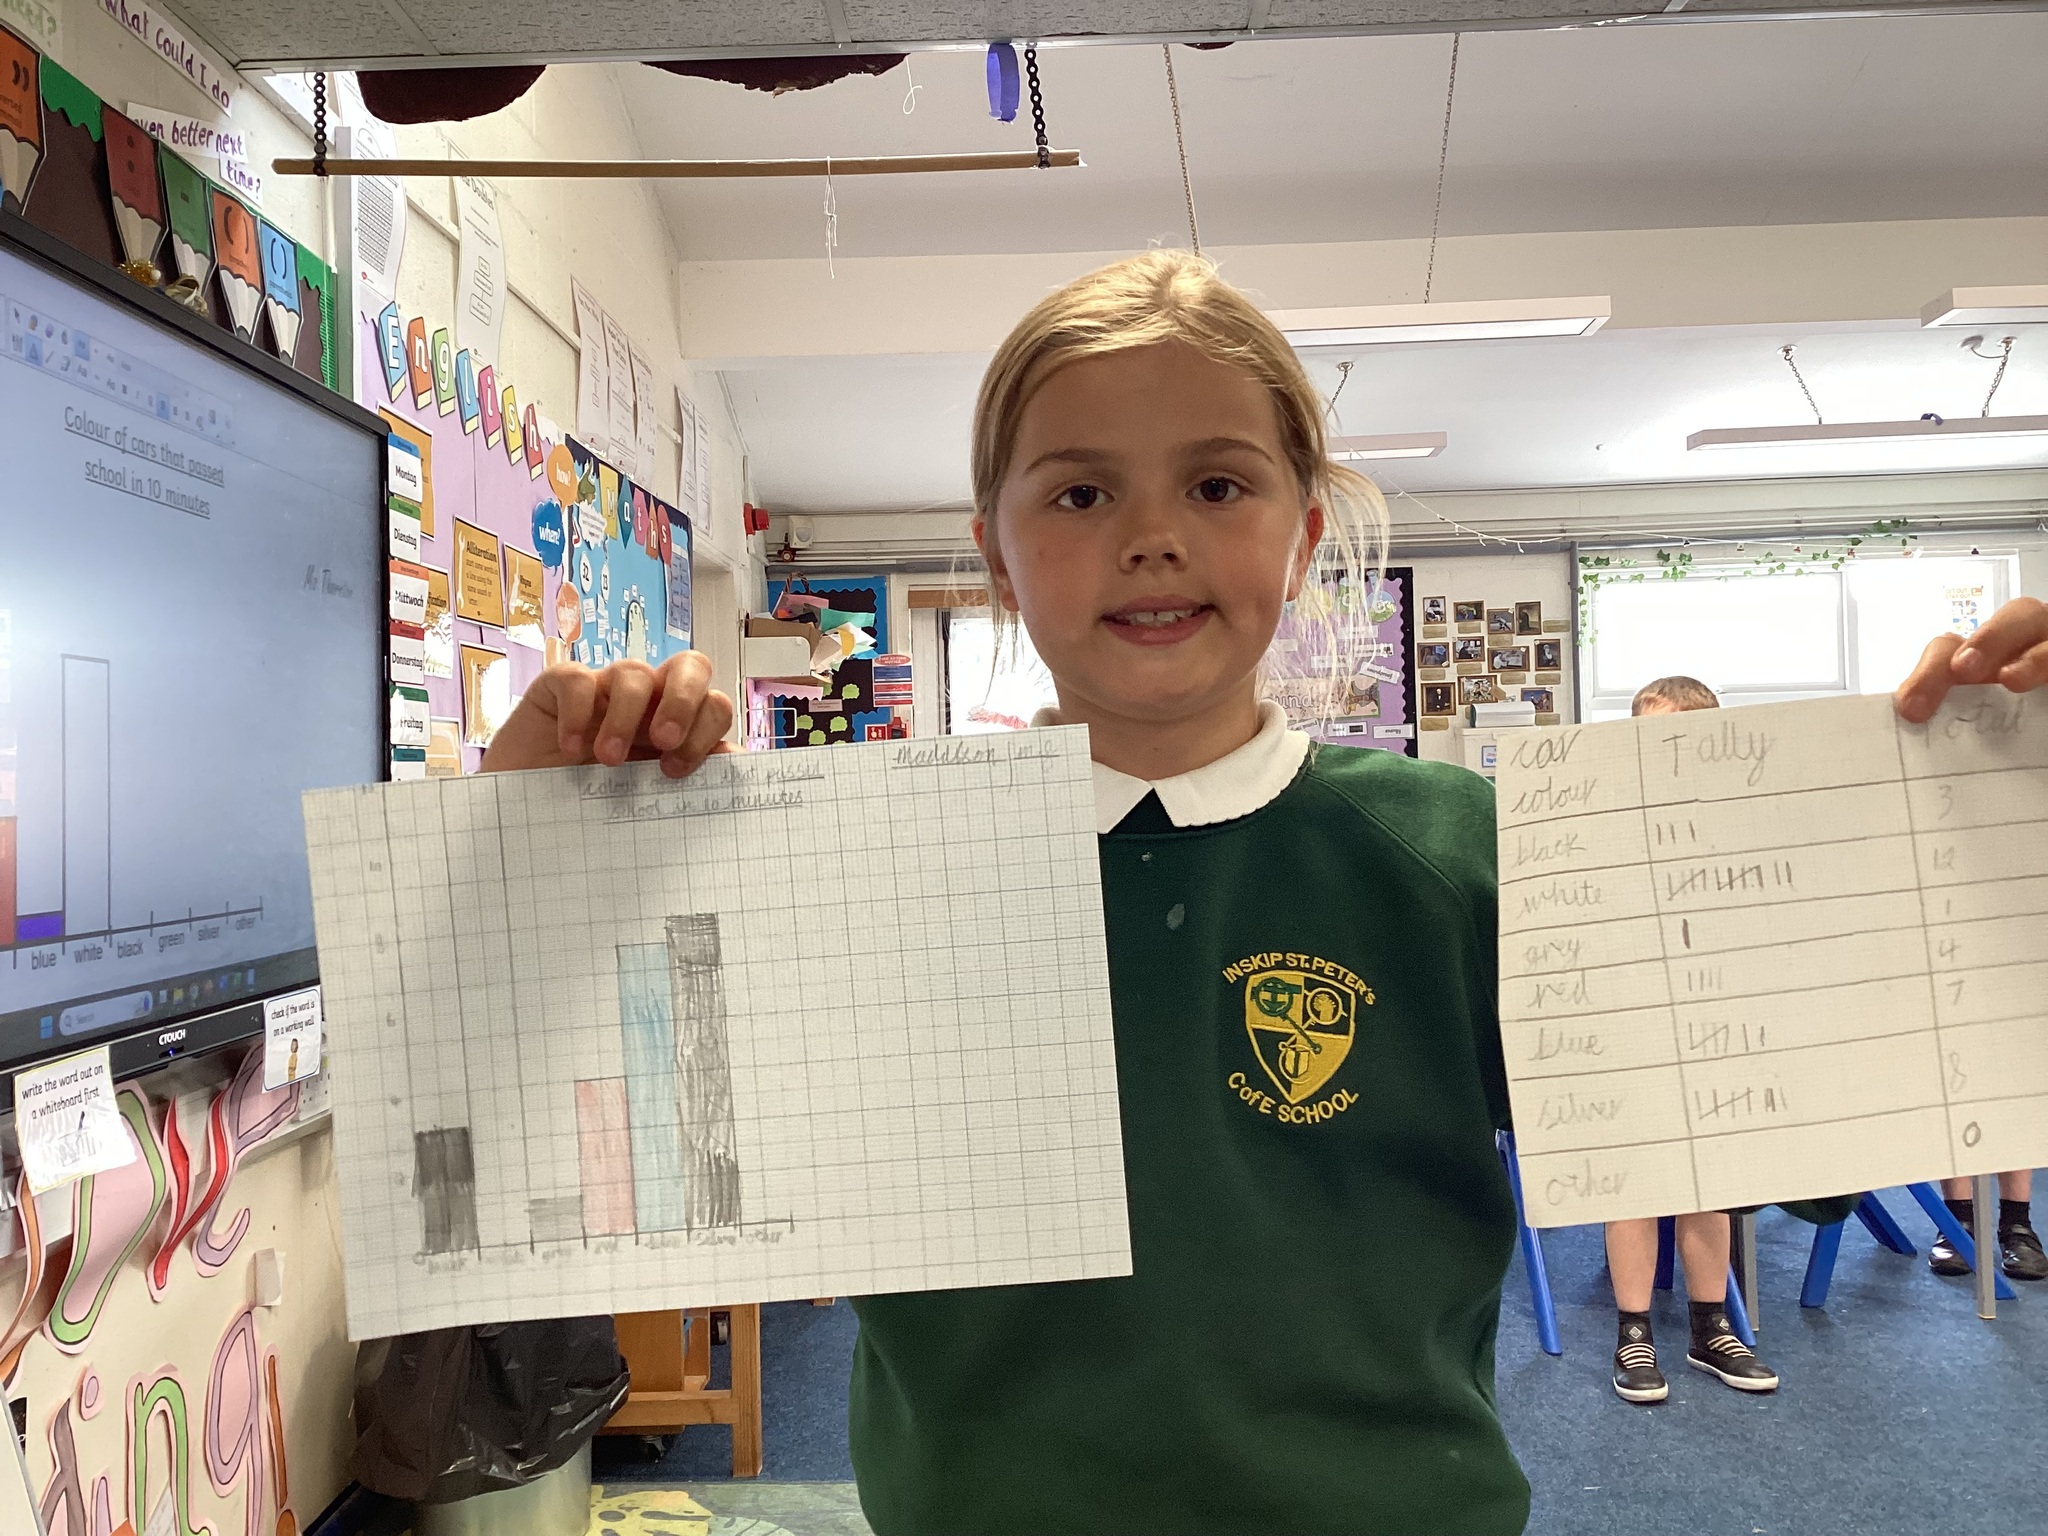
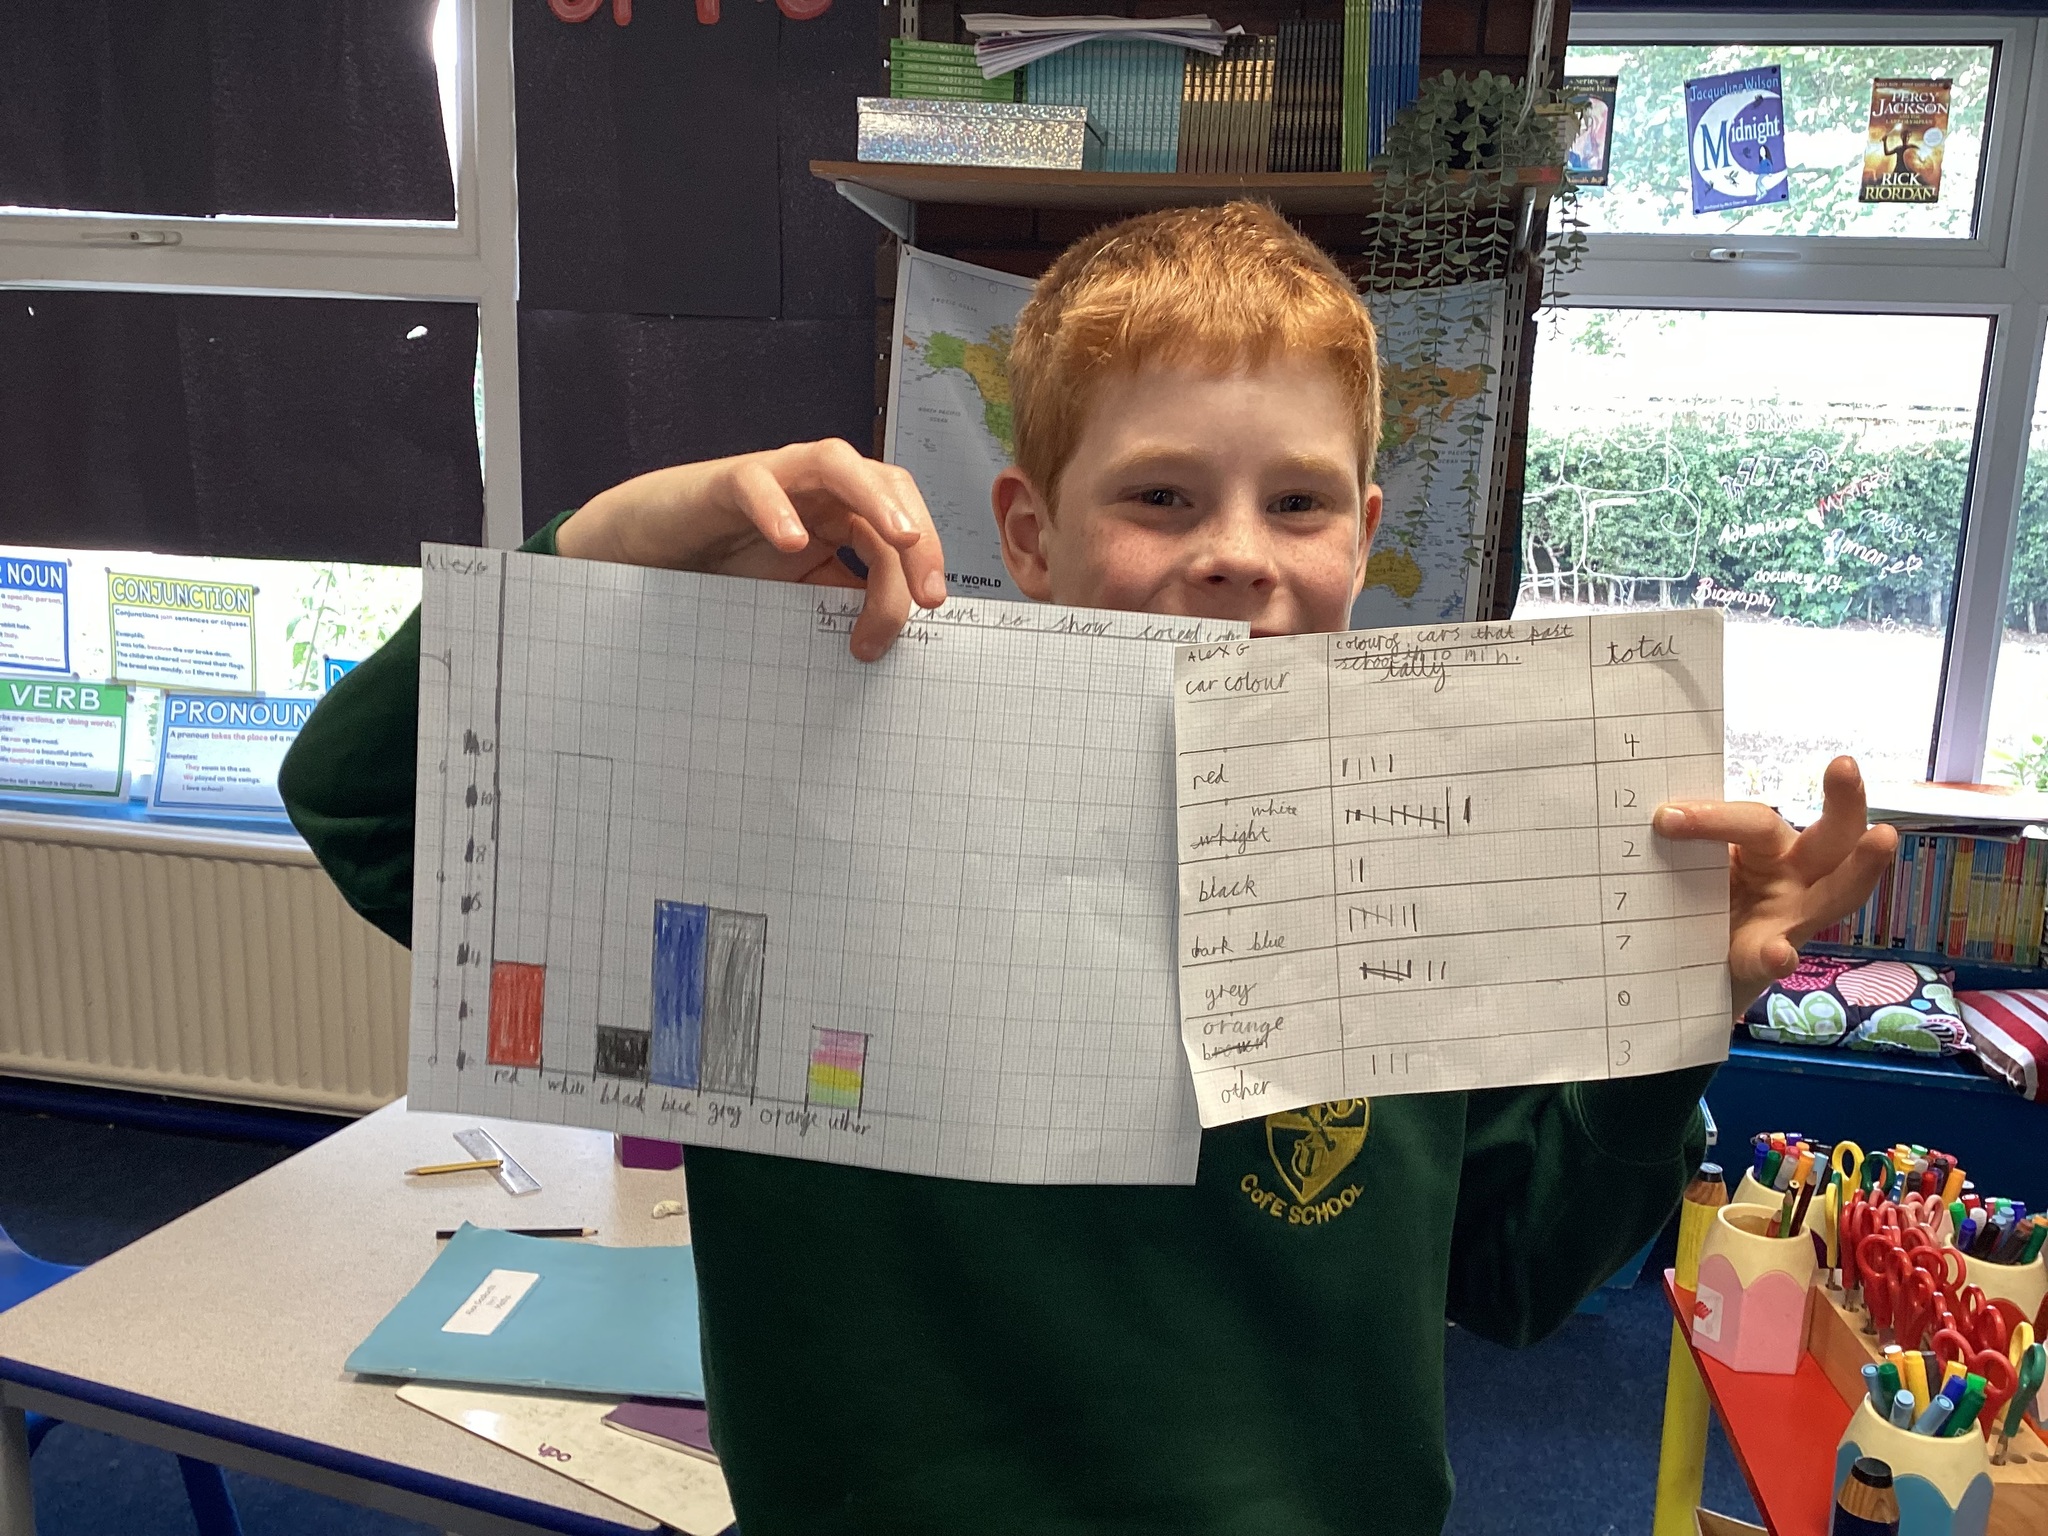
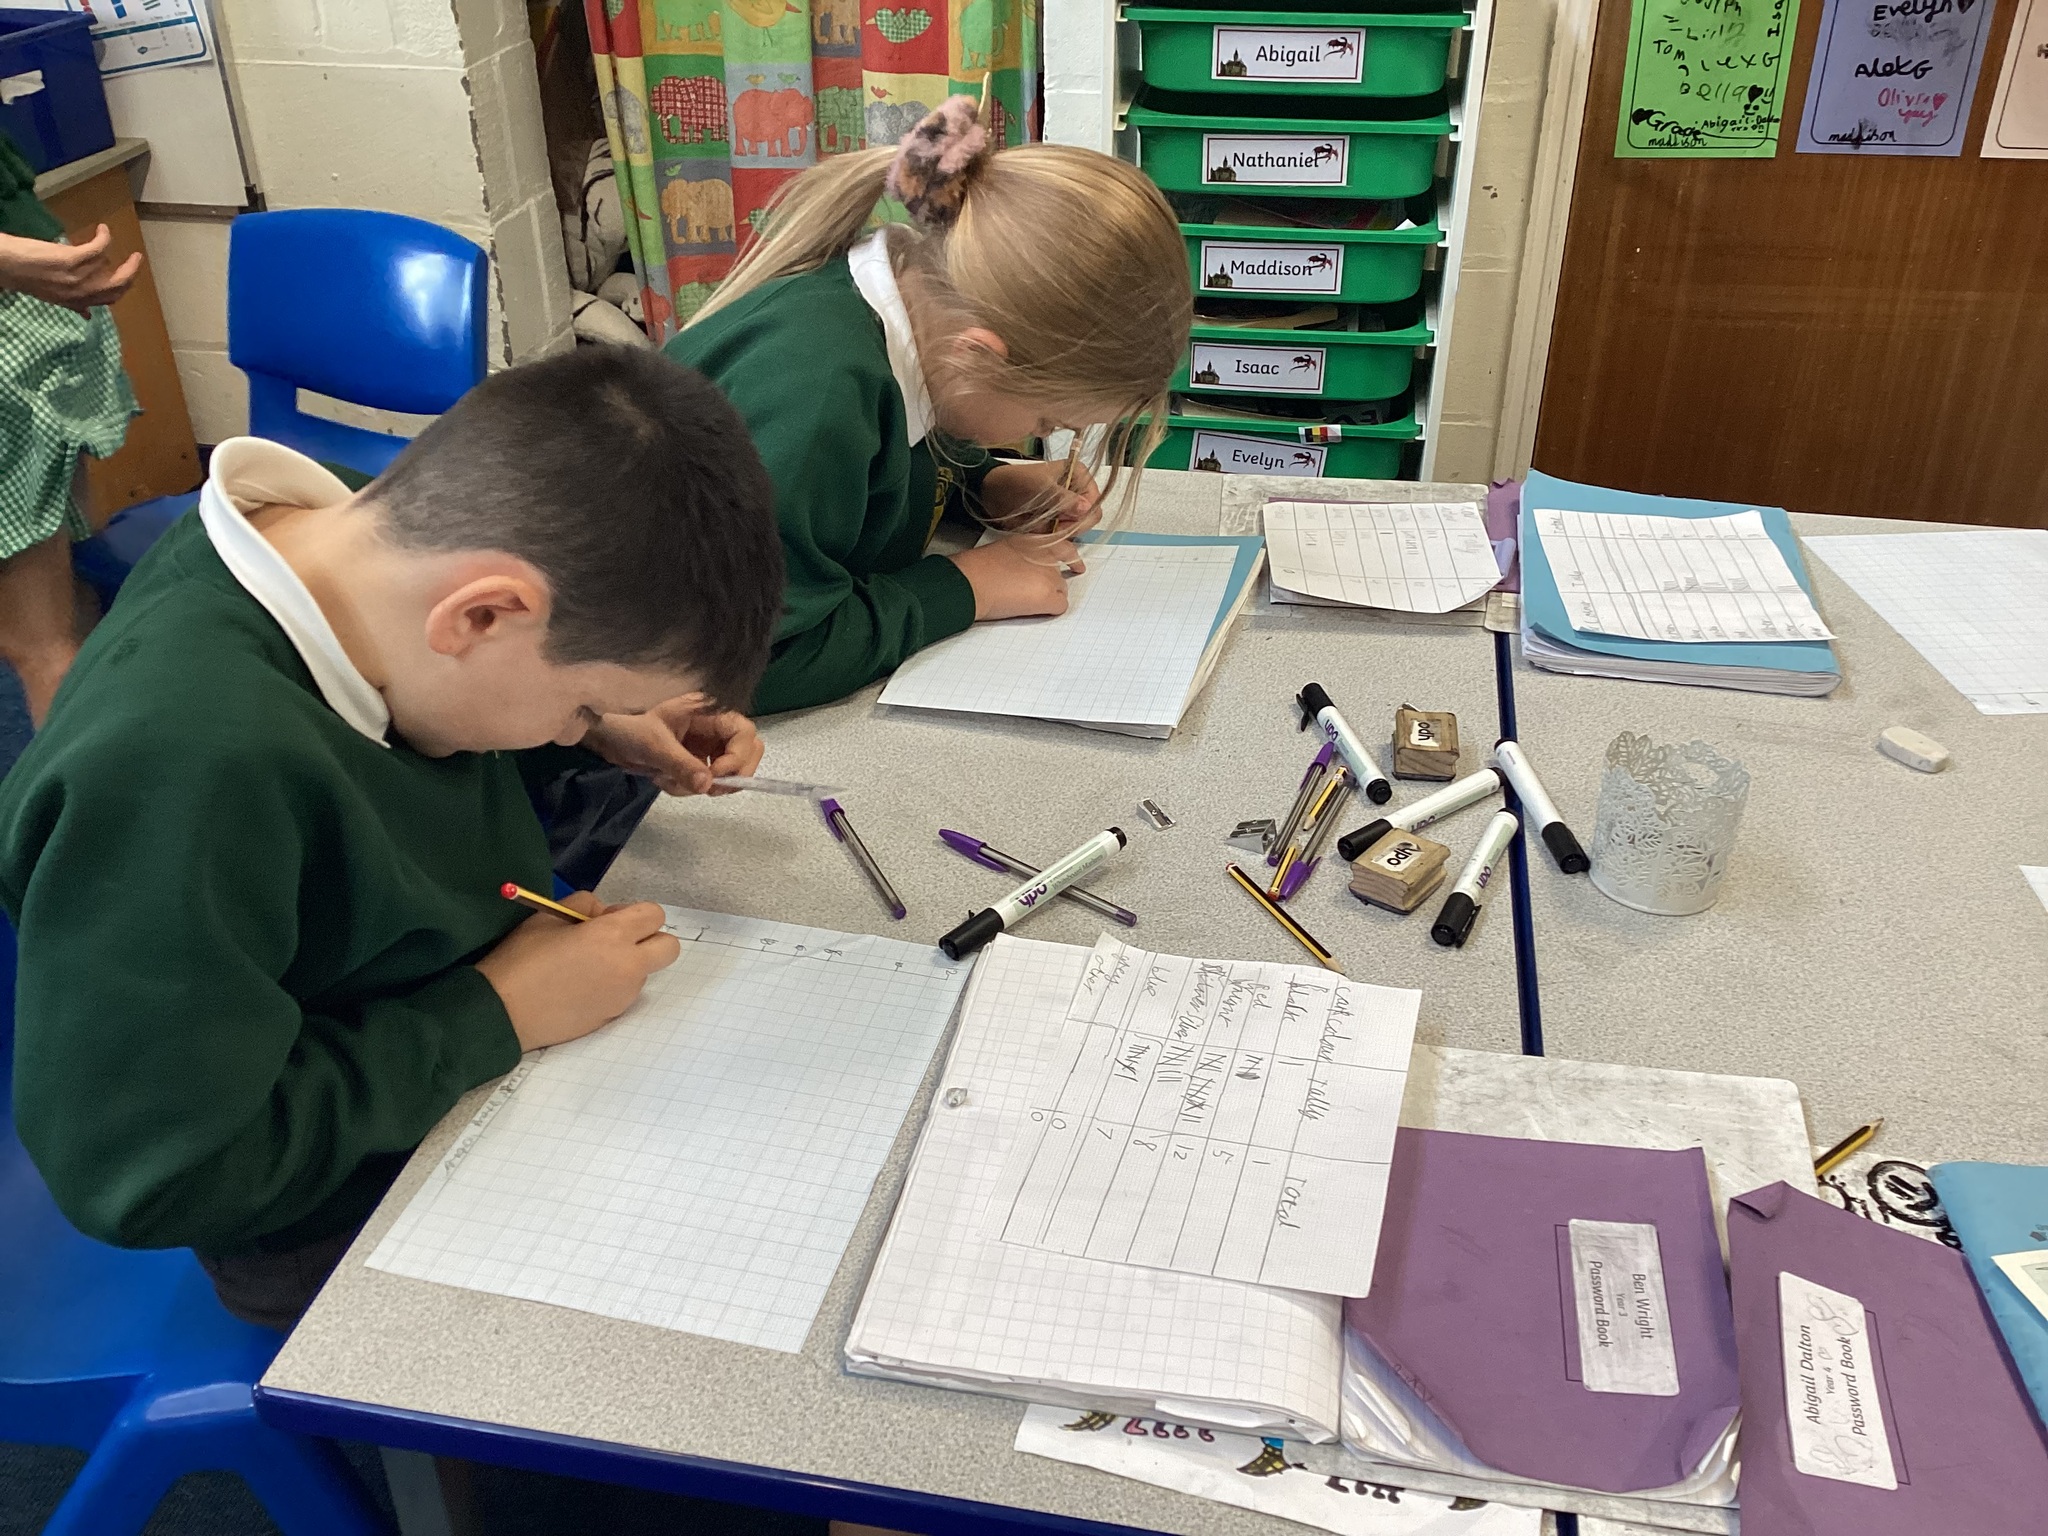
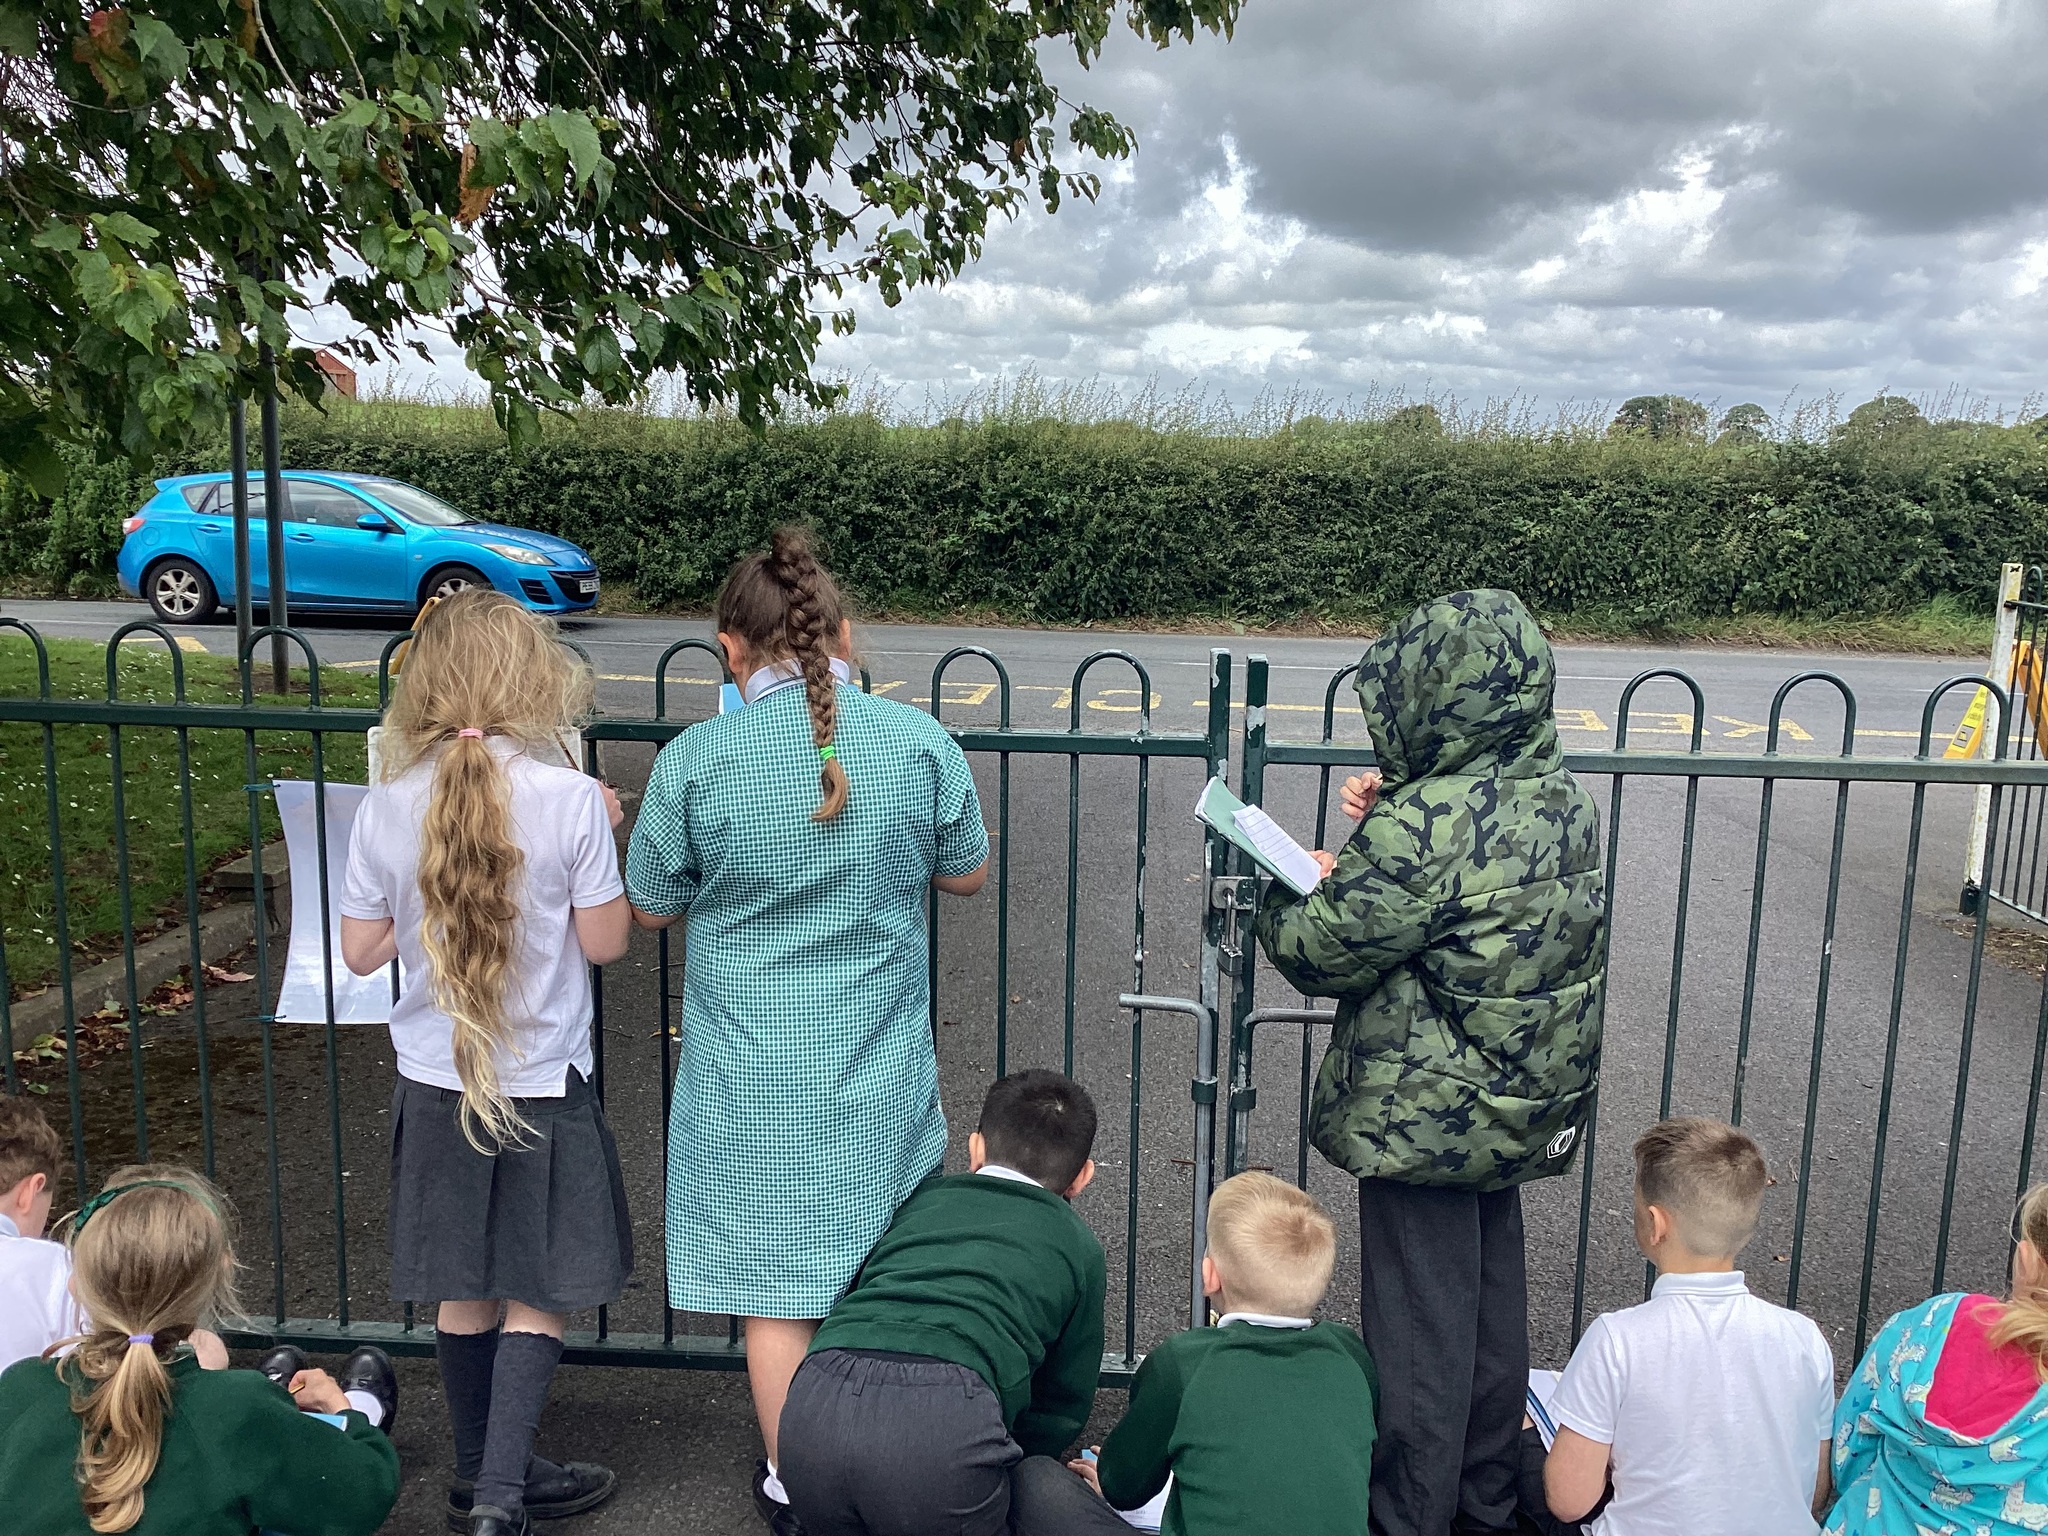
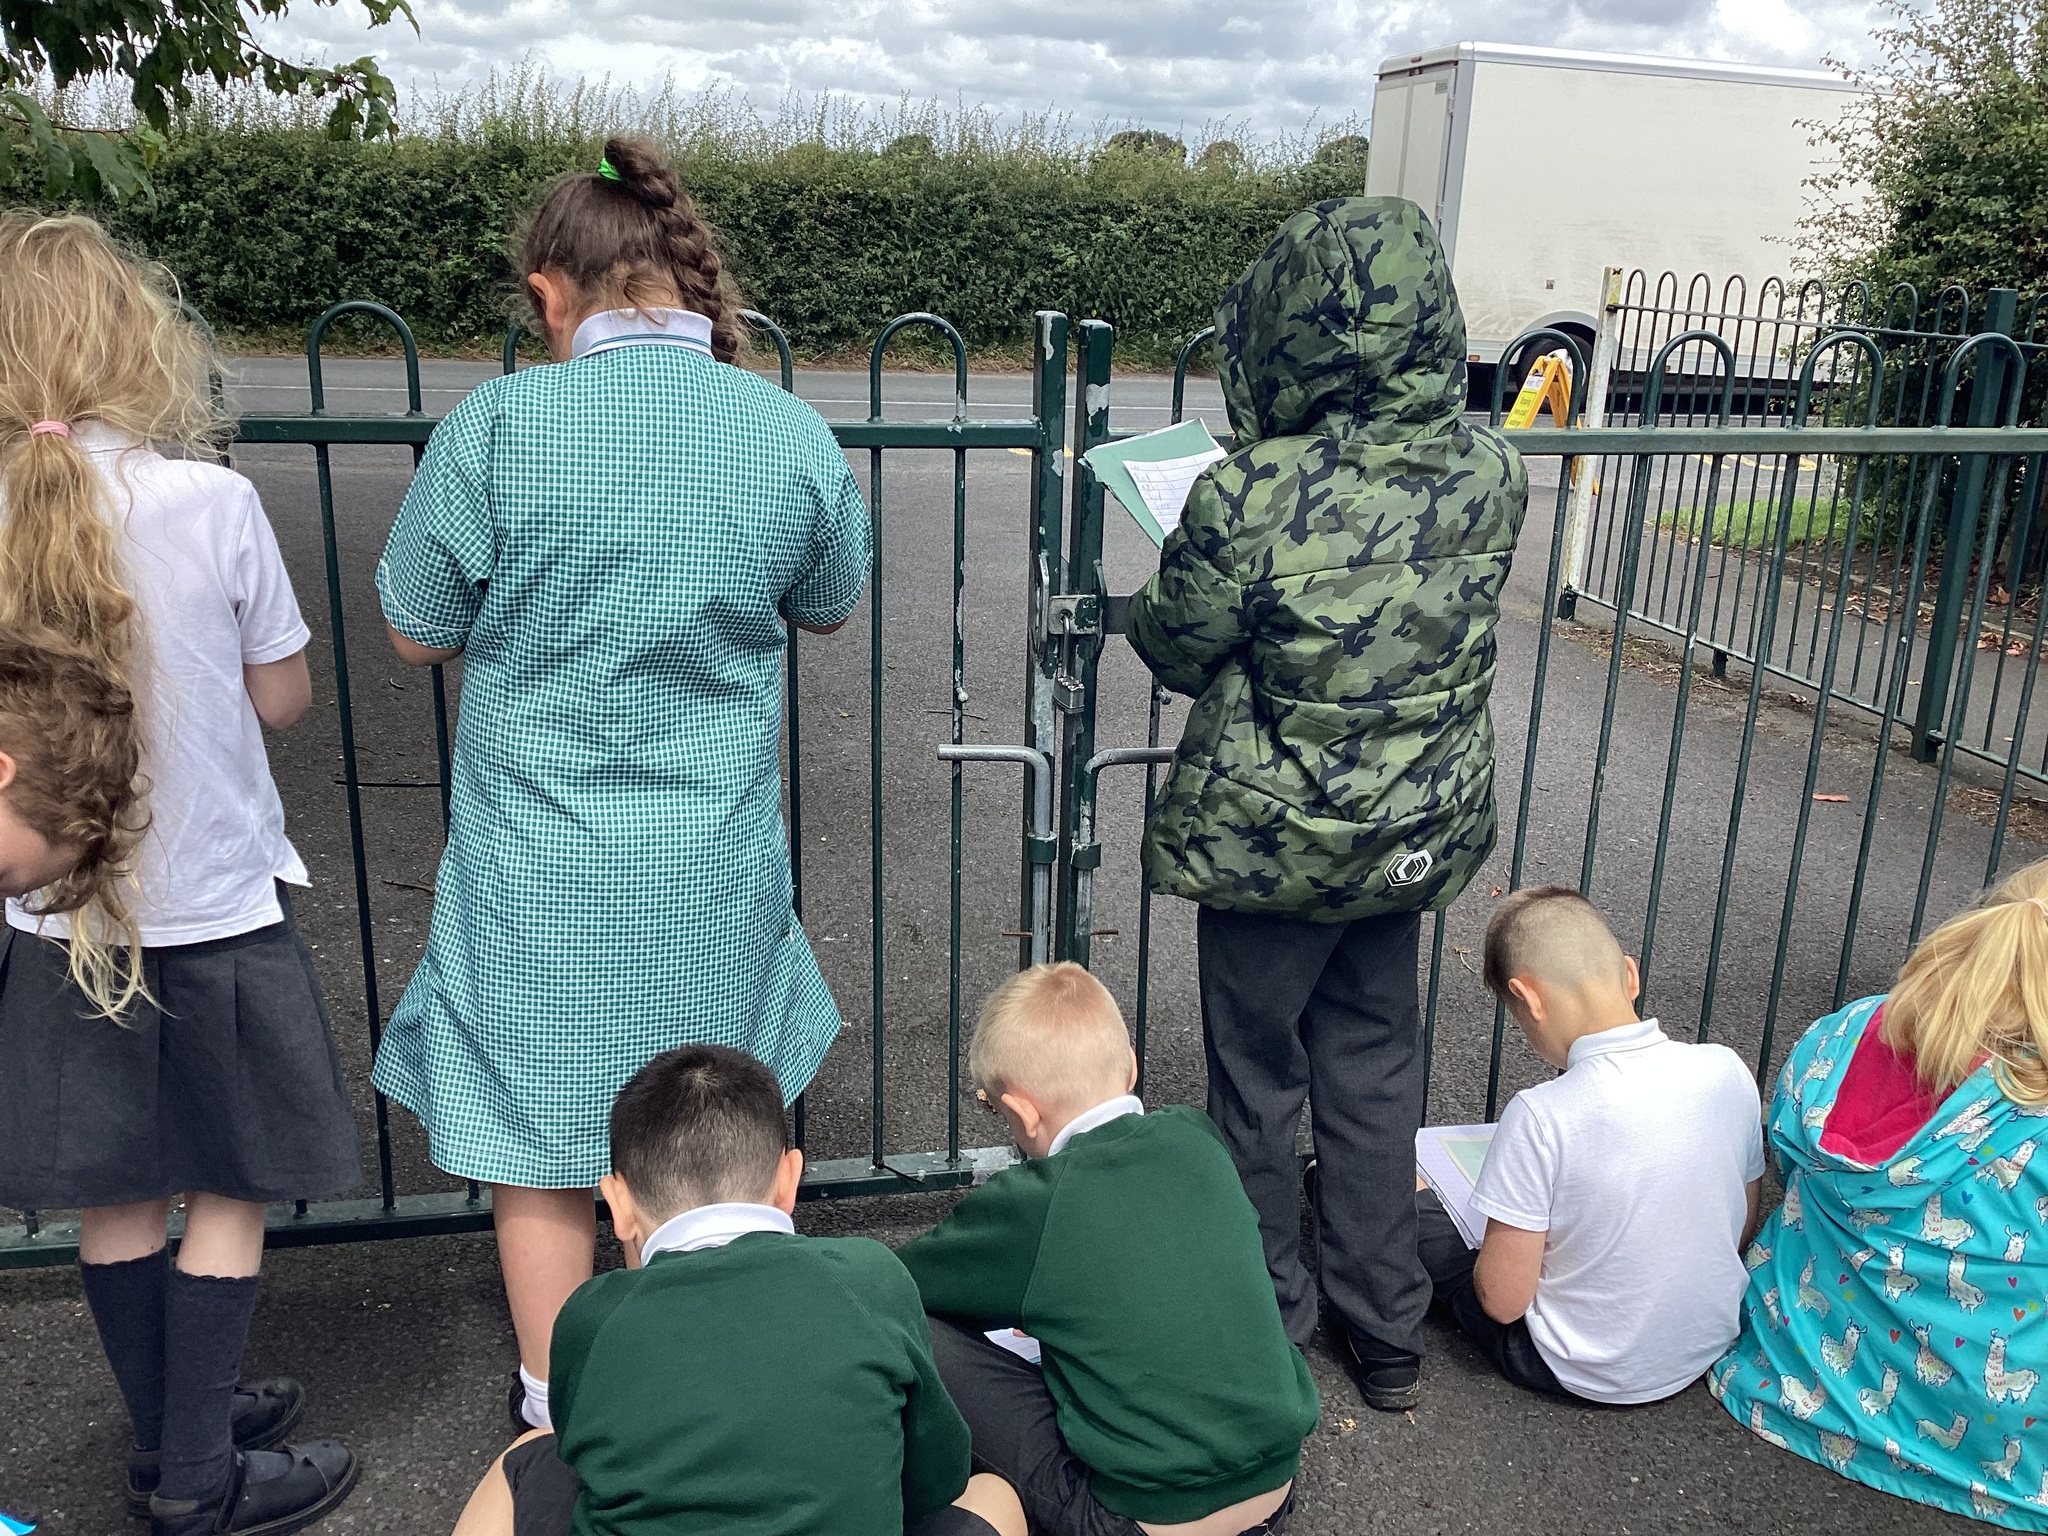
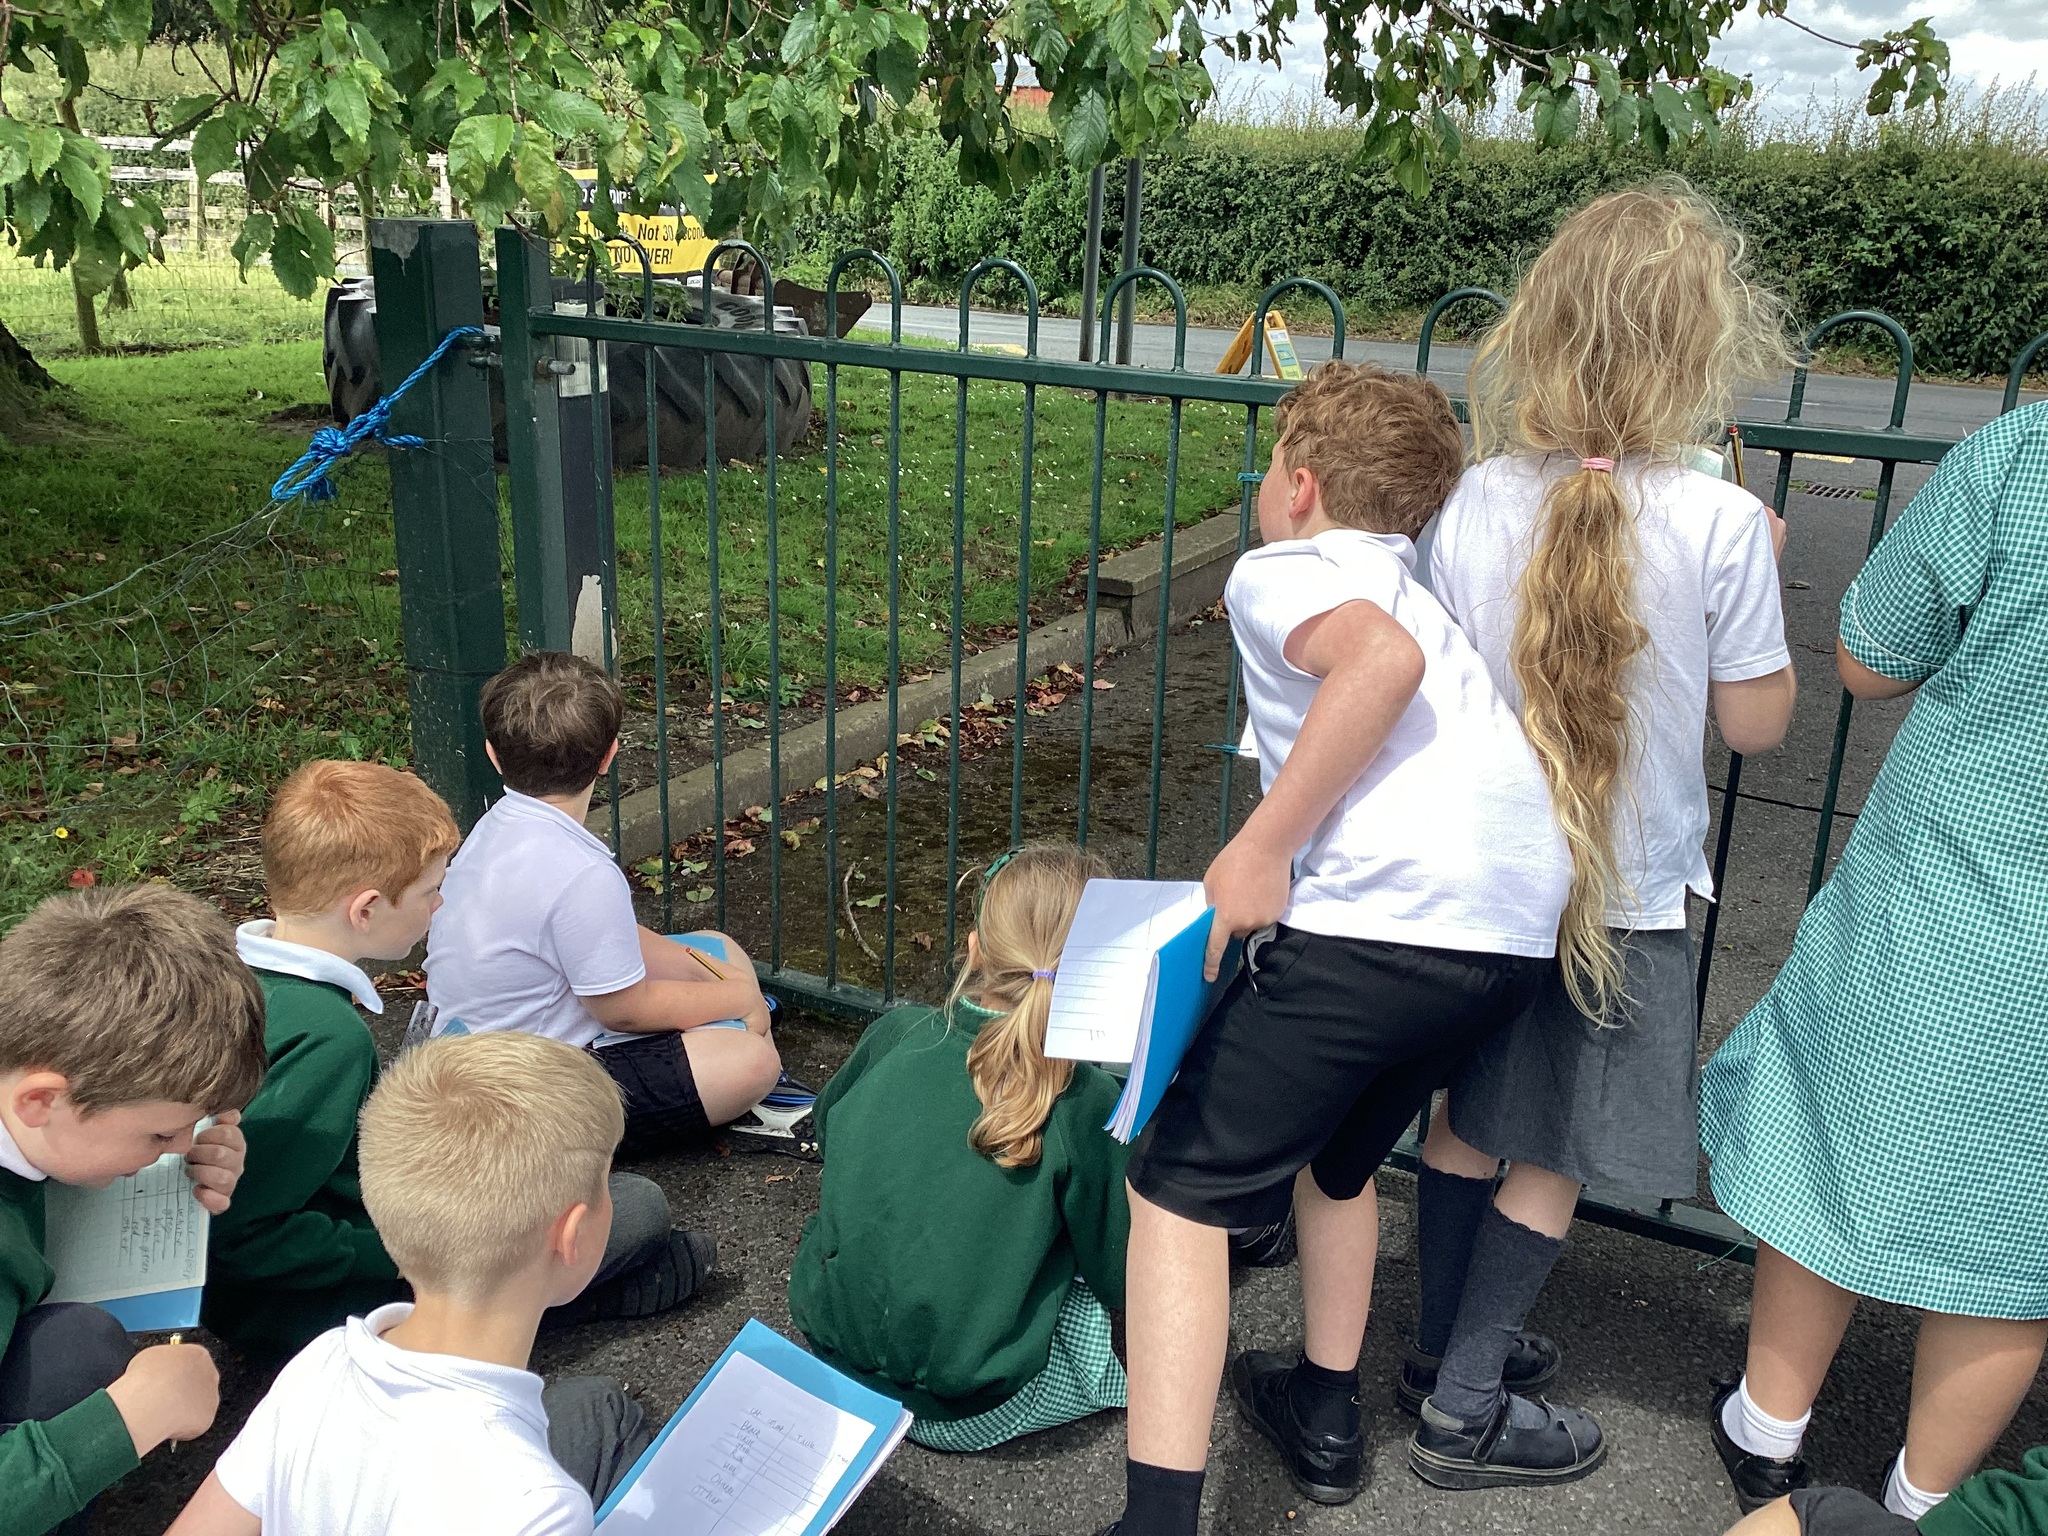
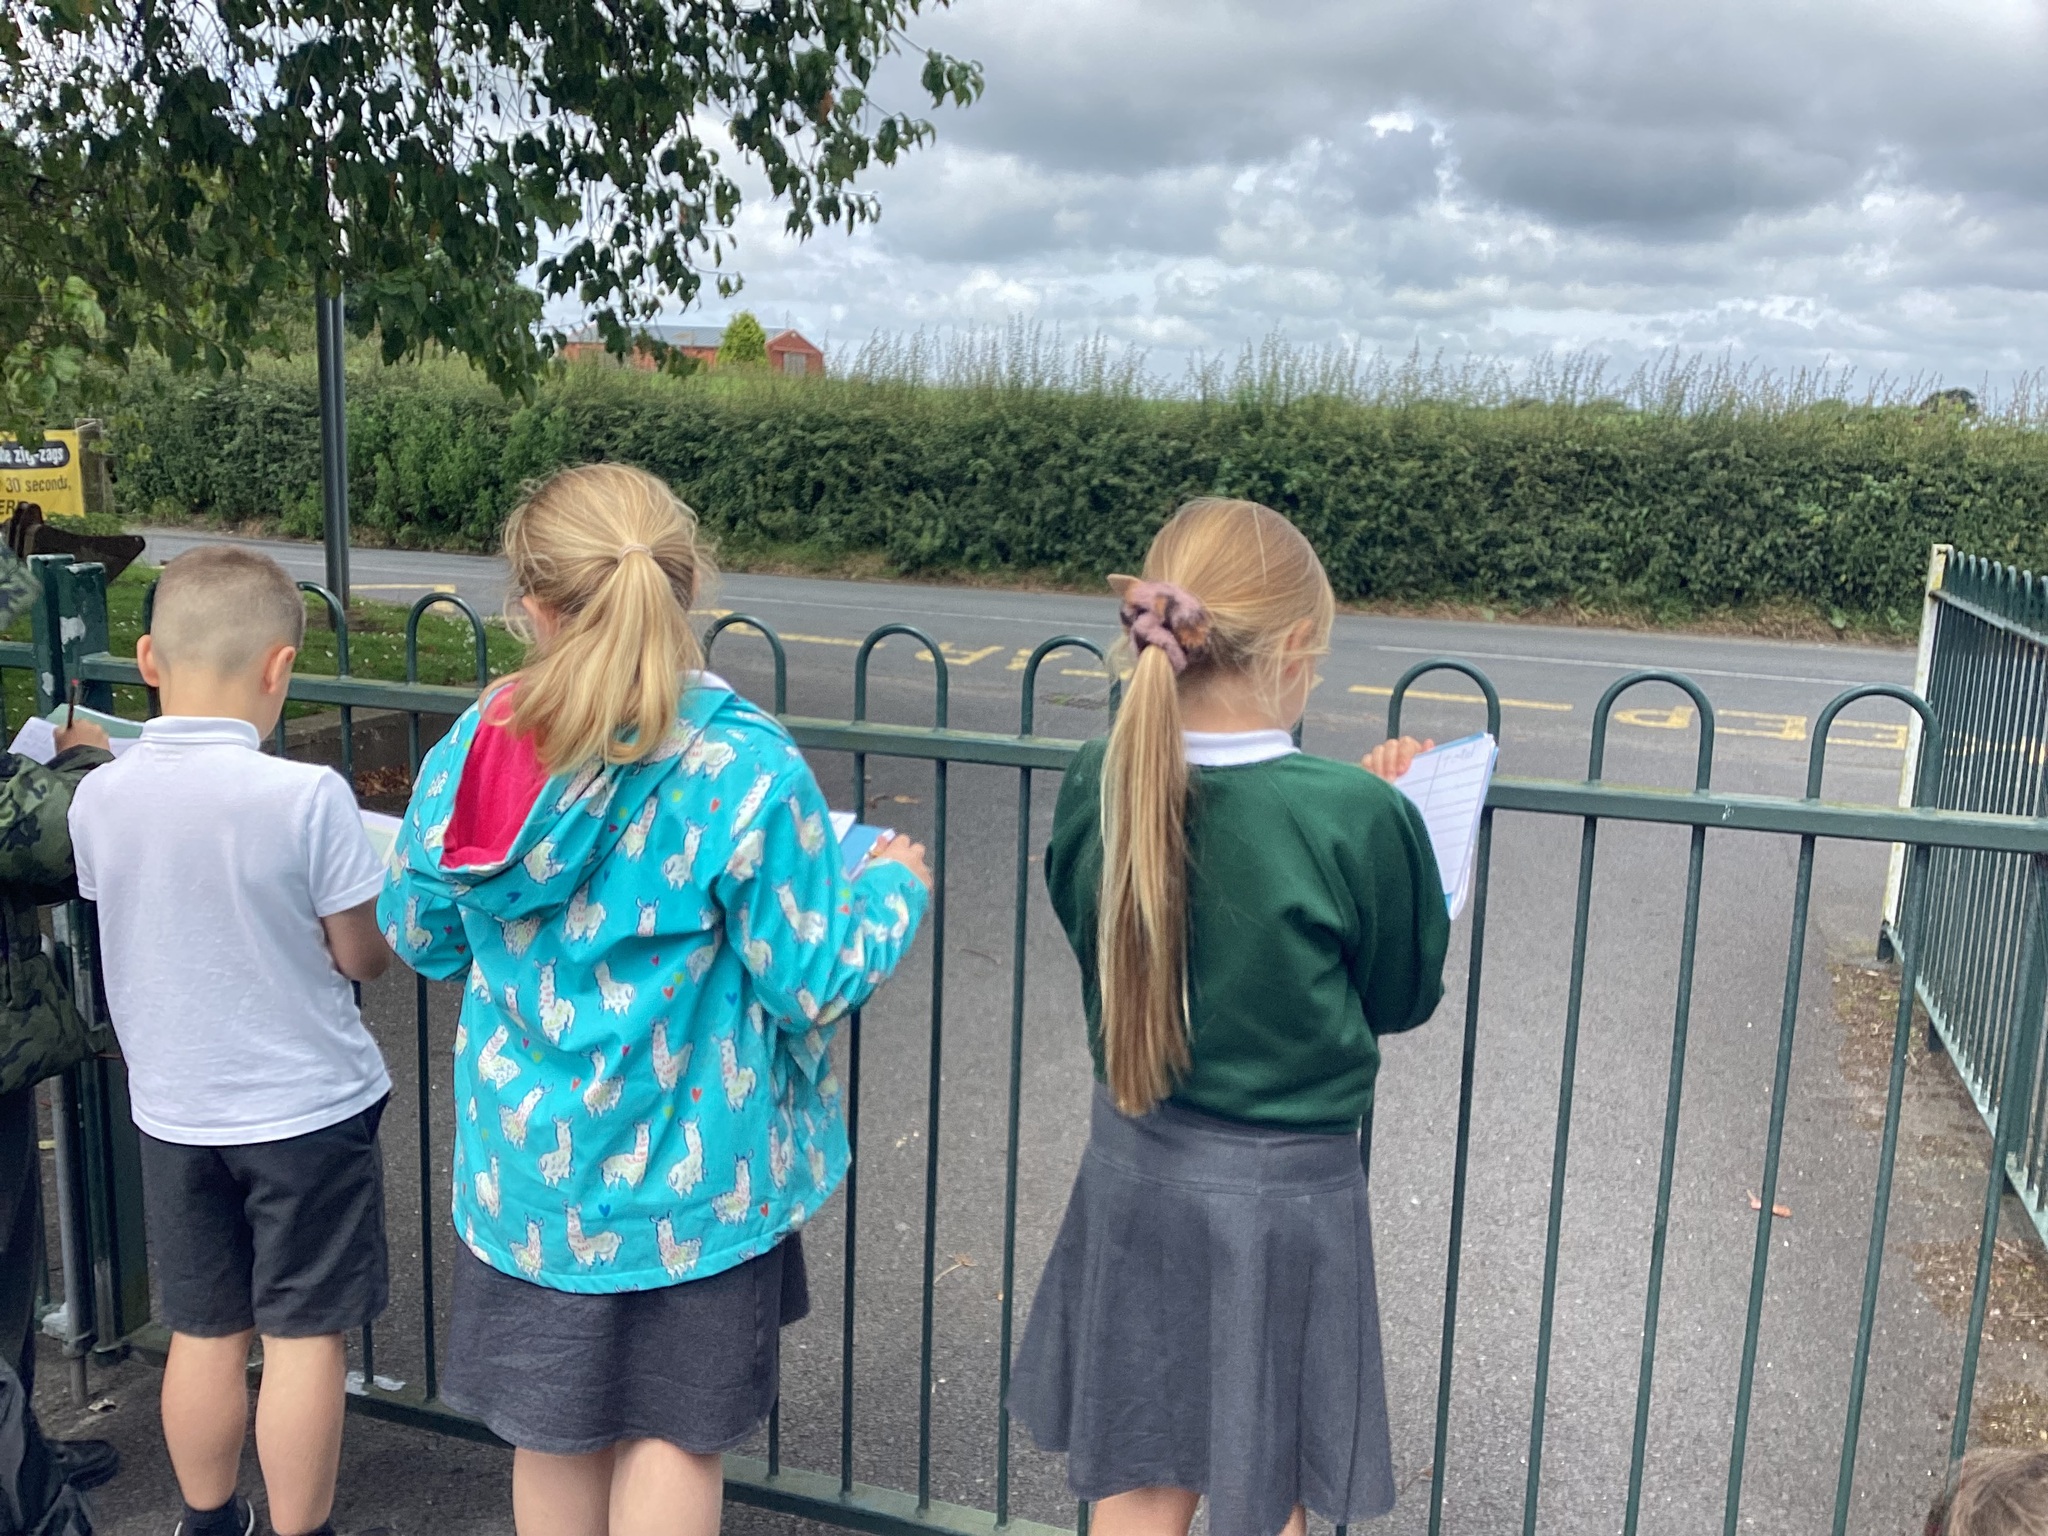
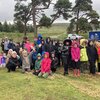
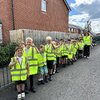
We started with a tally and decided to note down something we'd done before - the colour of cars that passed the school within 10 minutes.
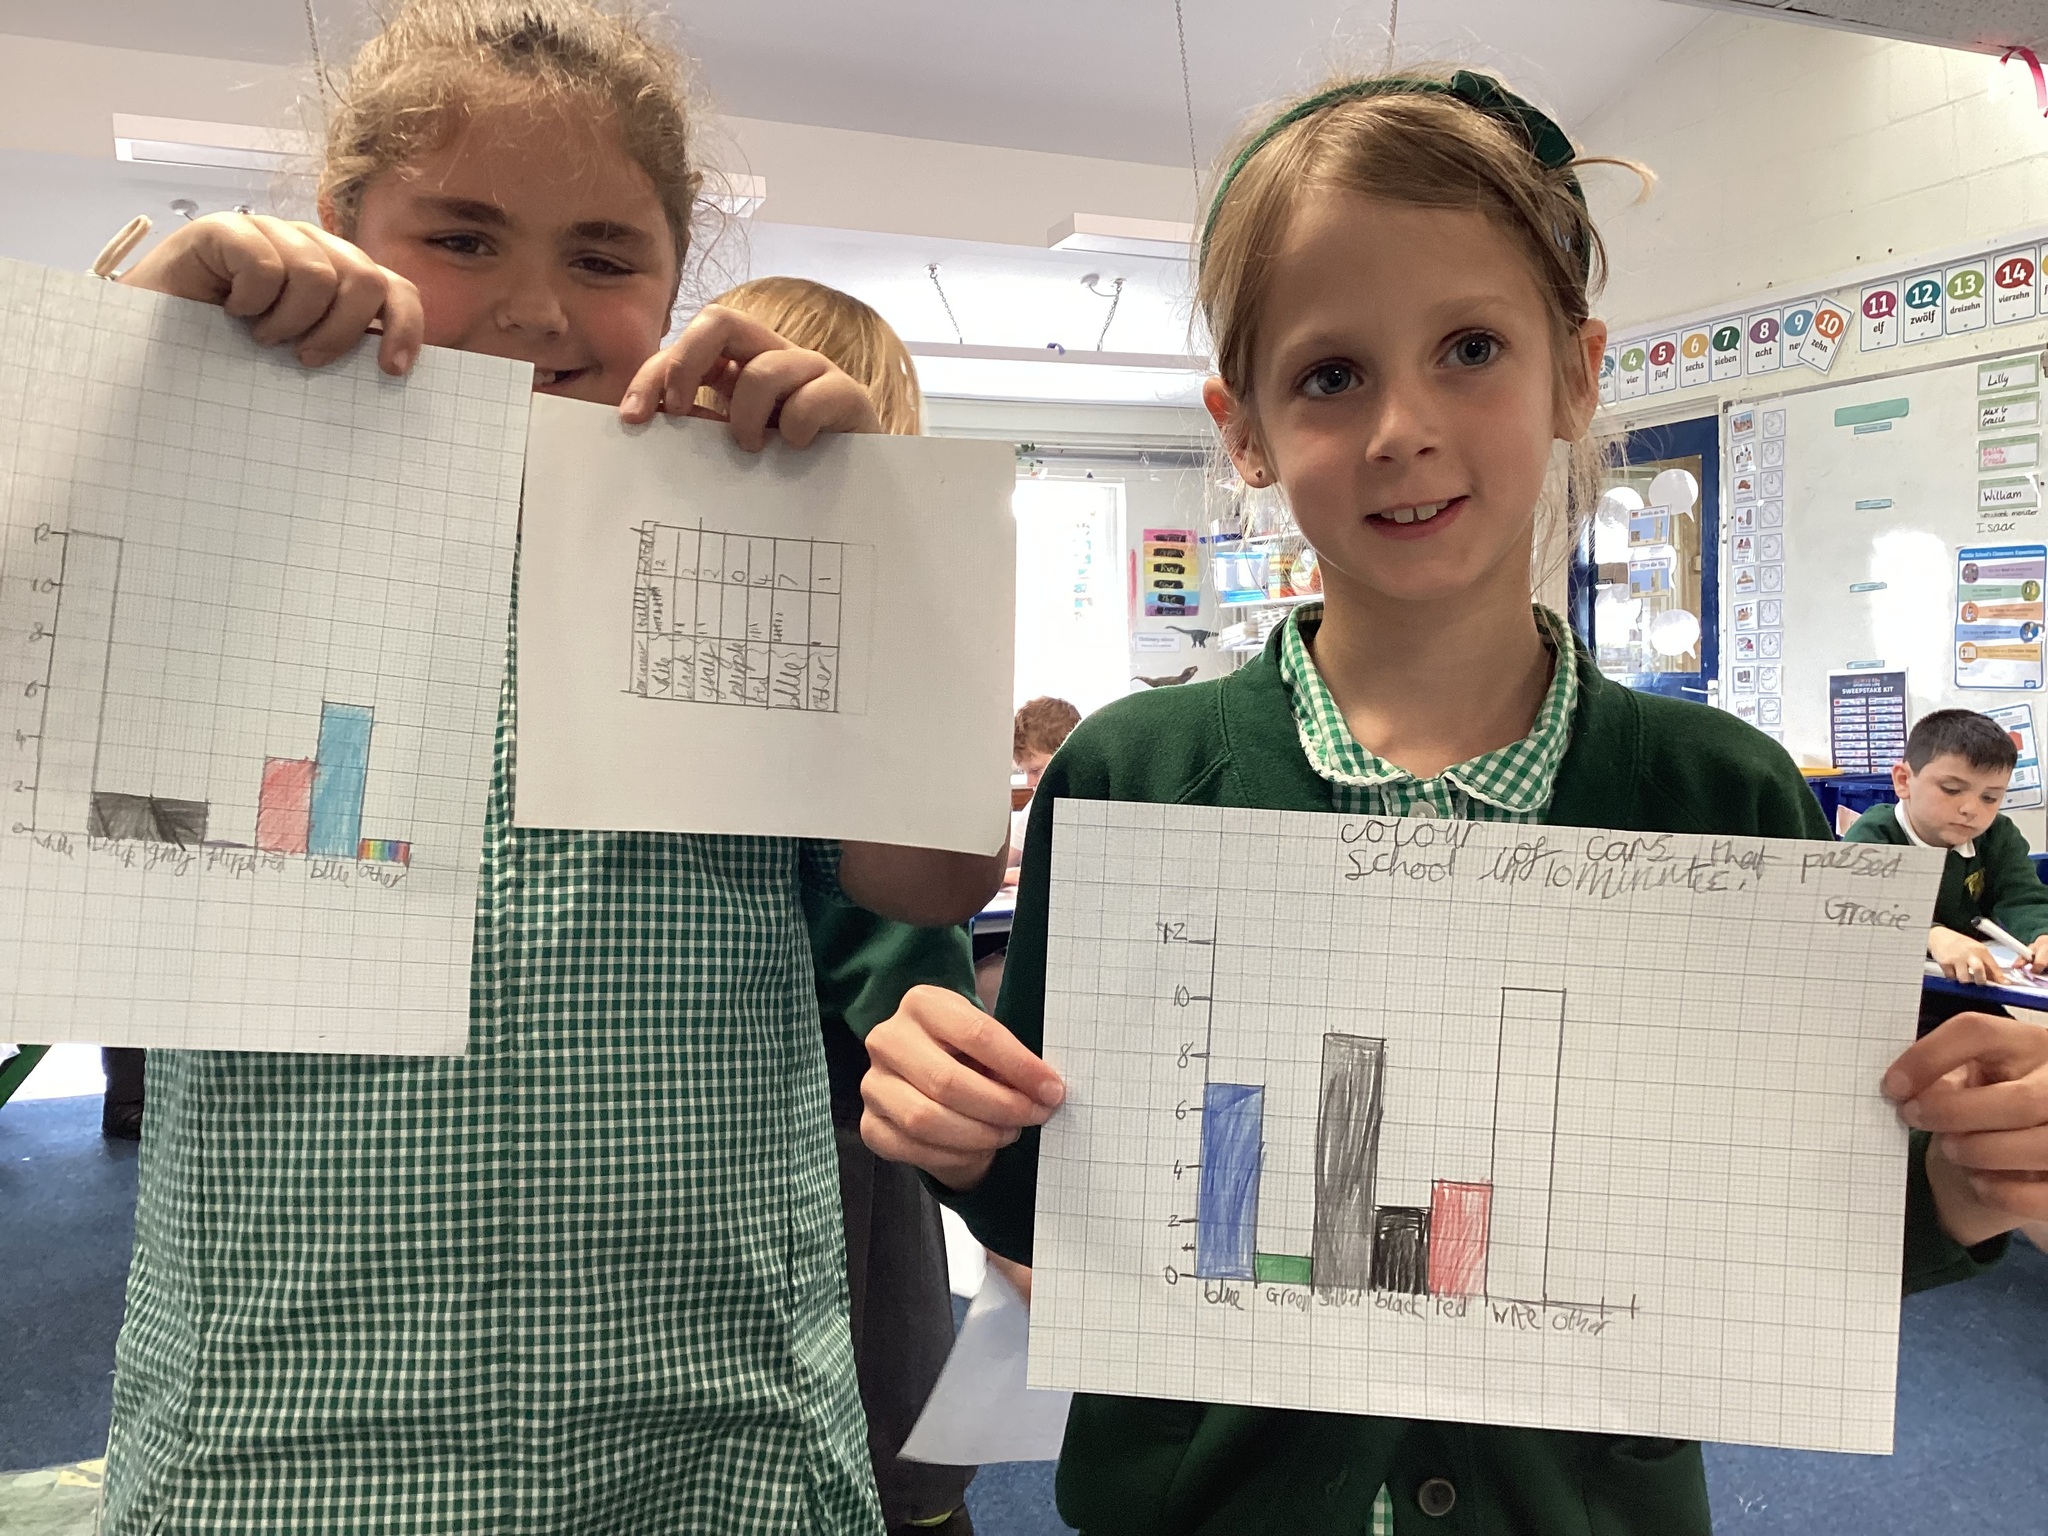
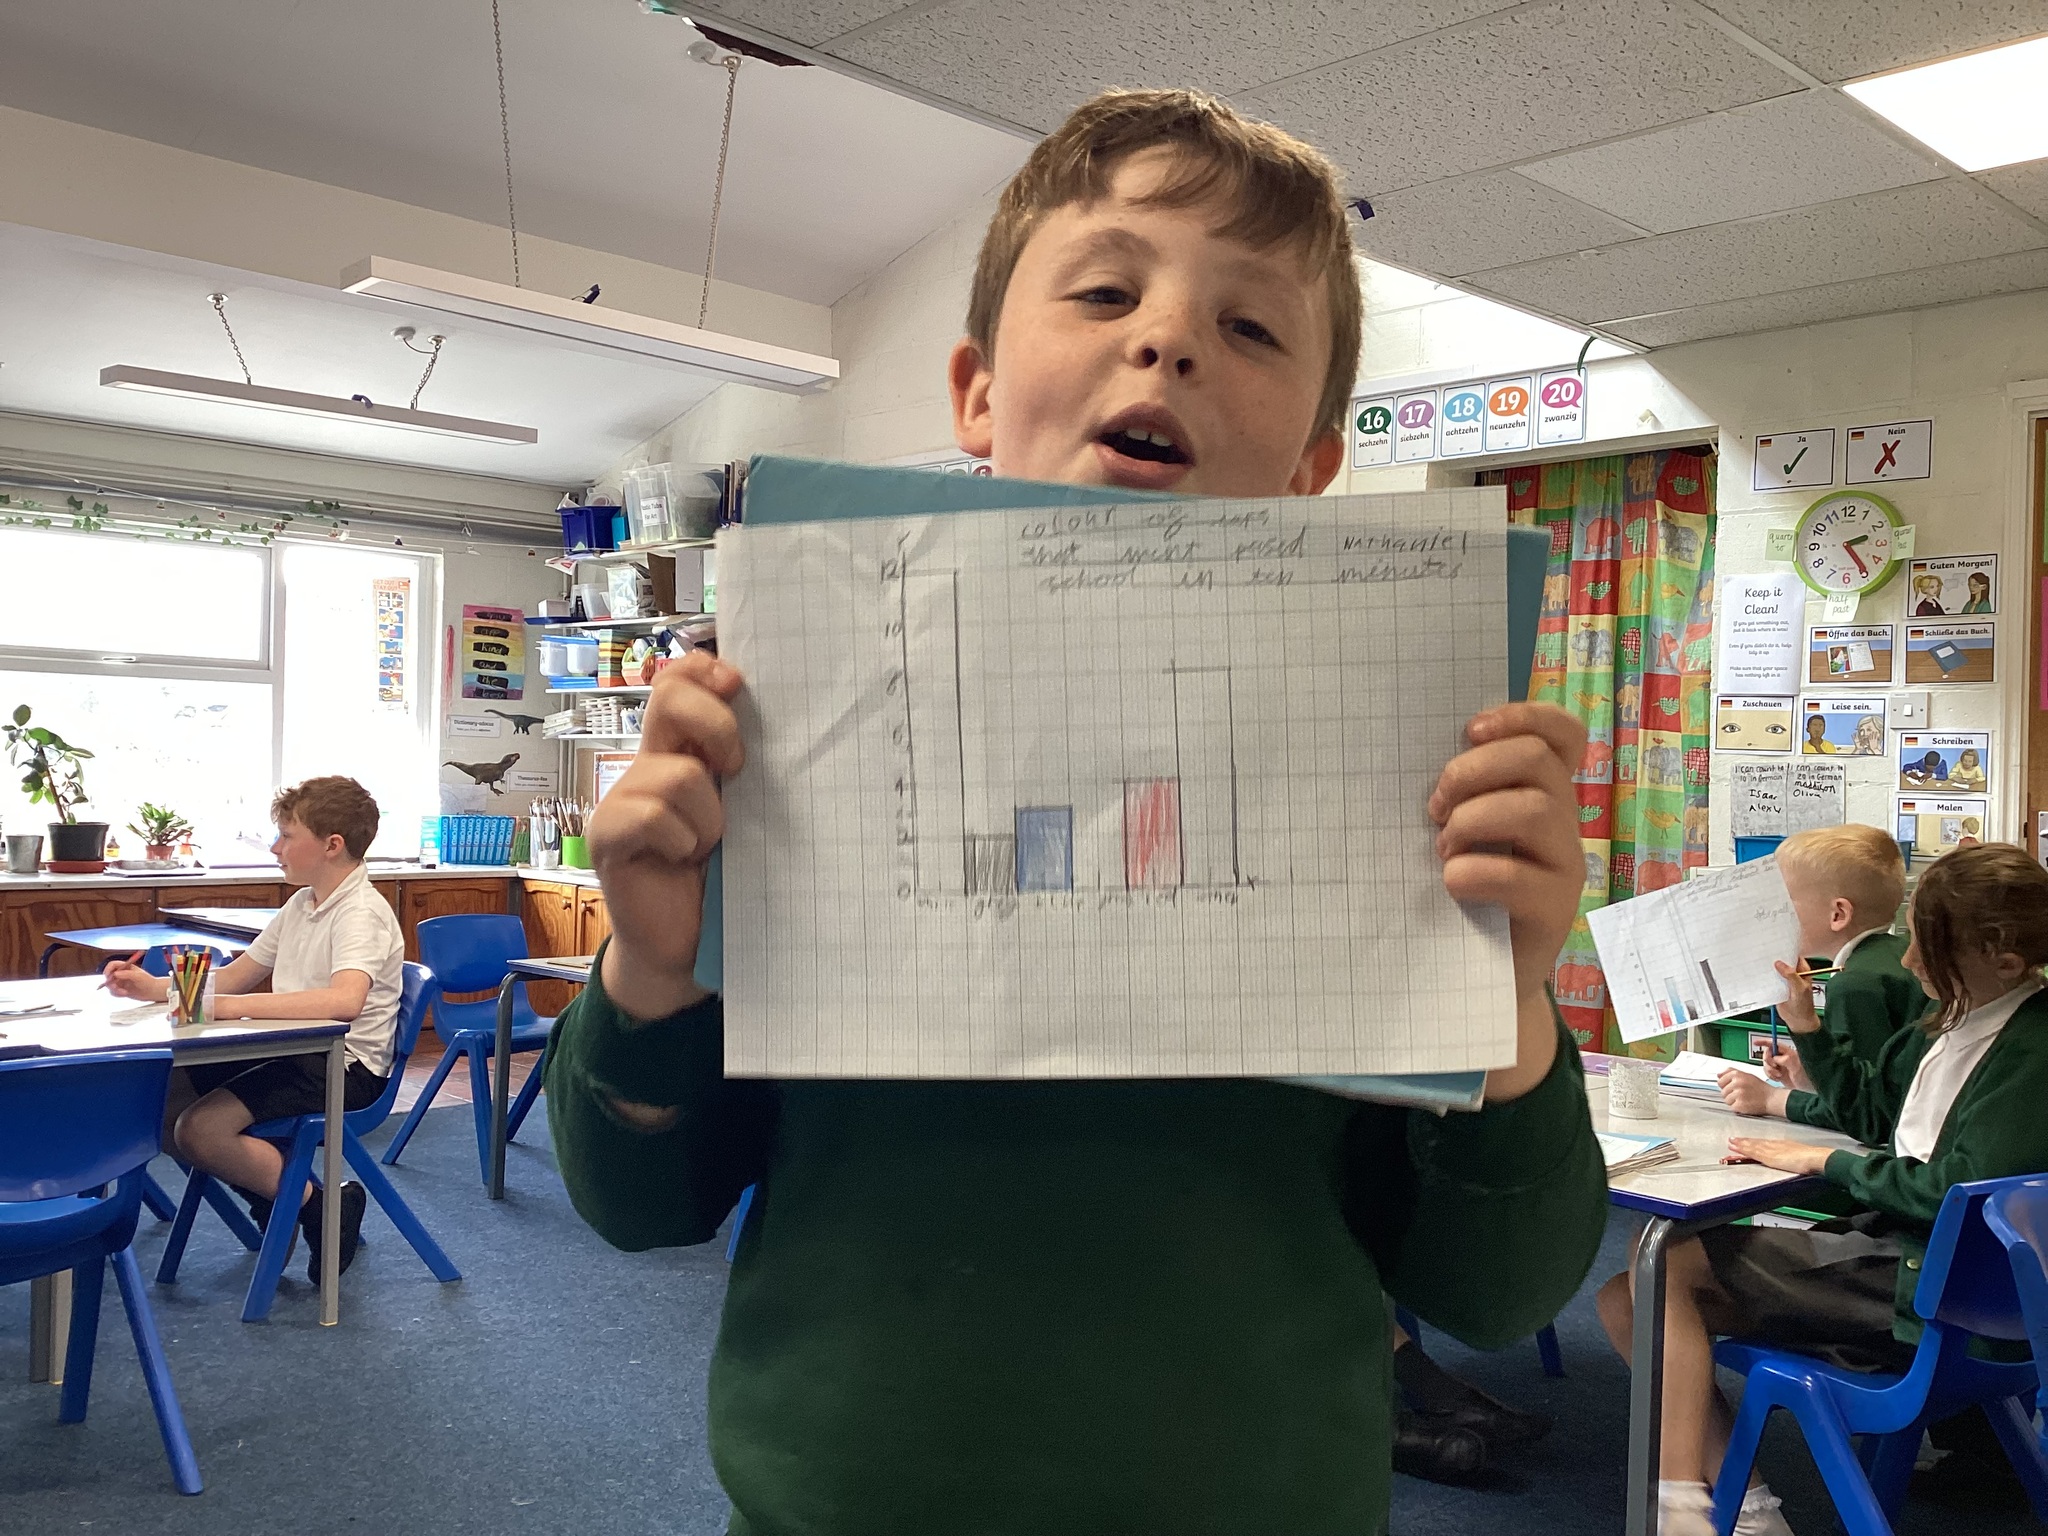
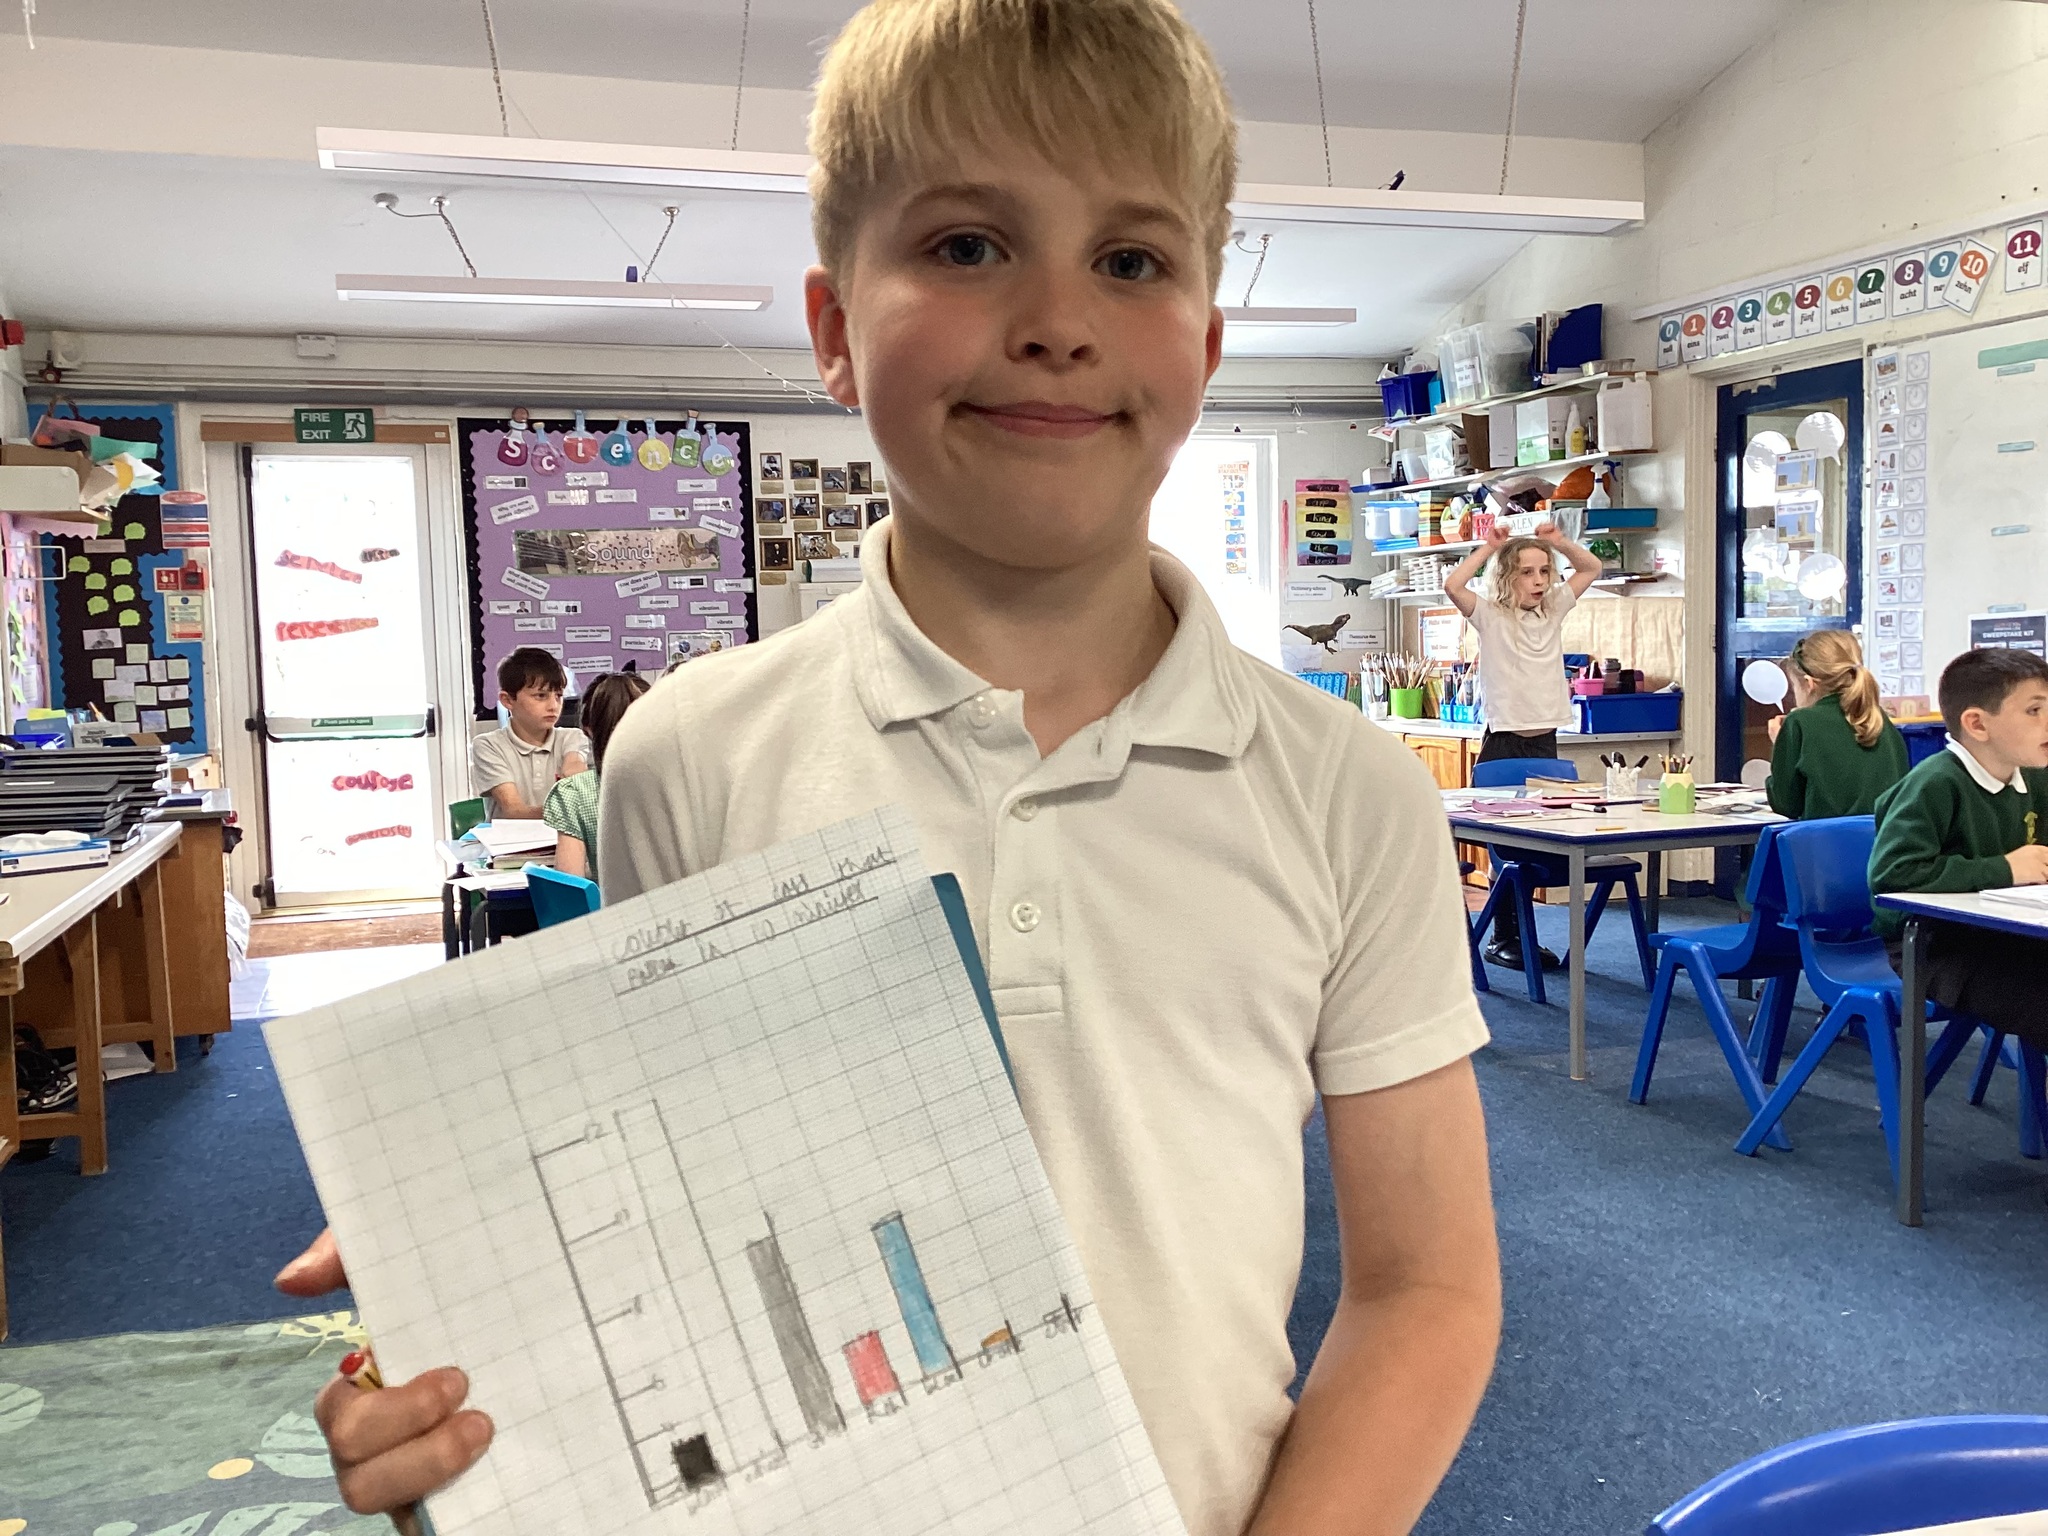
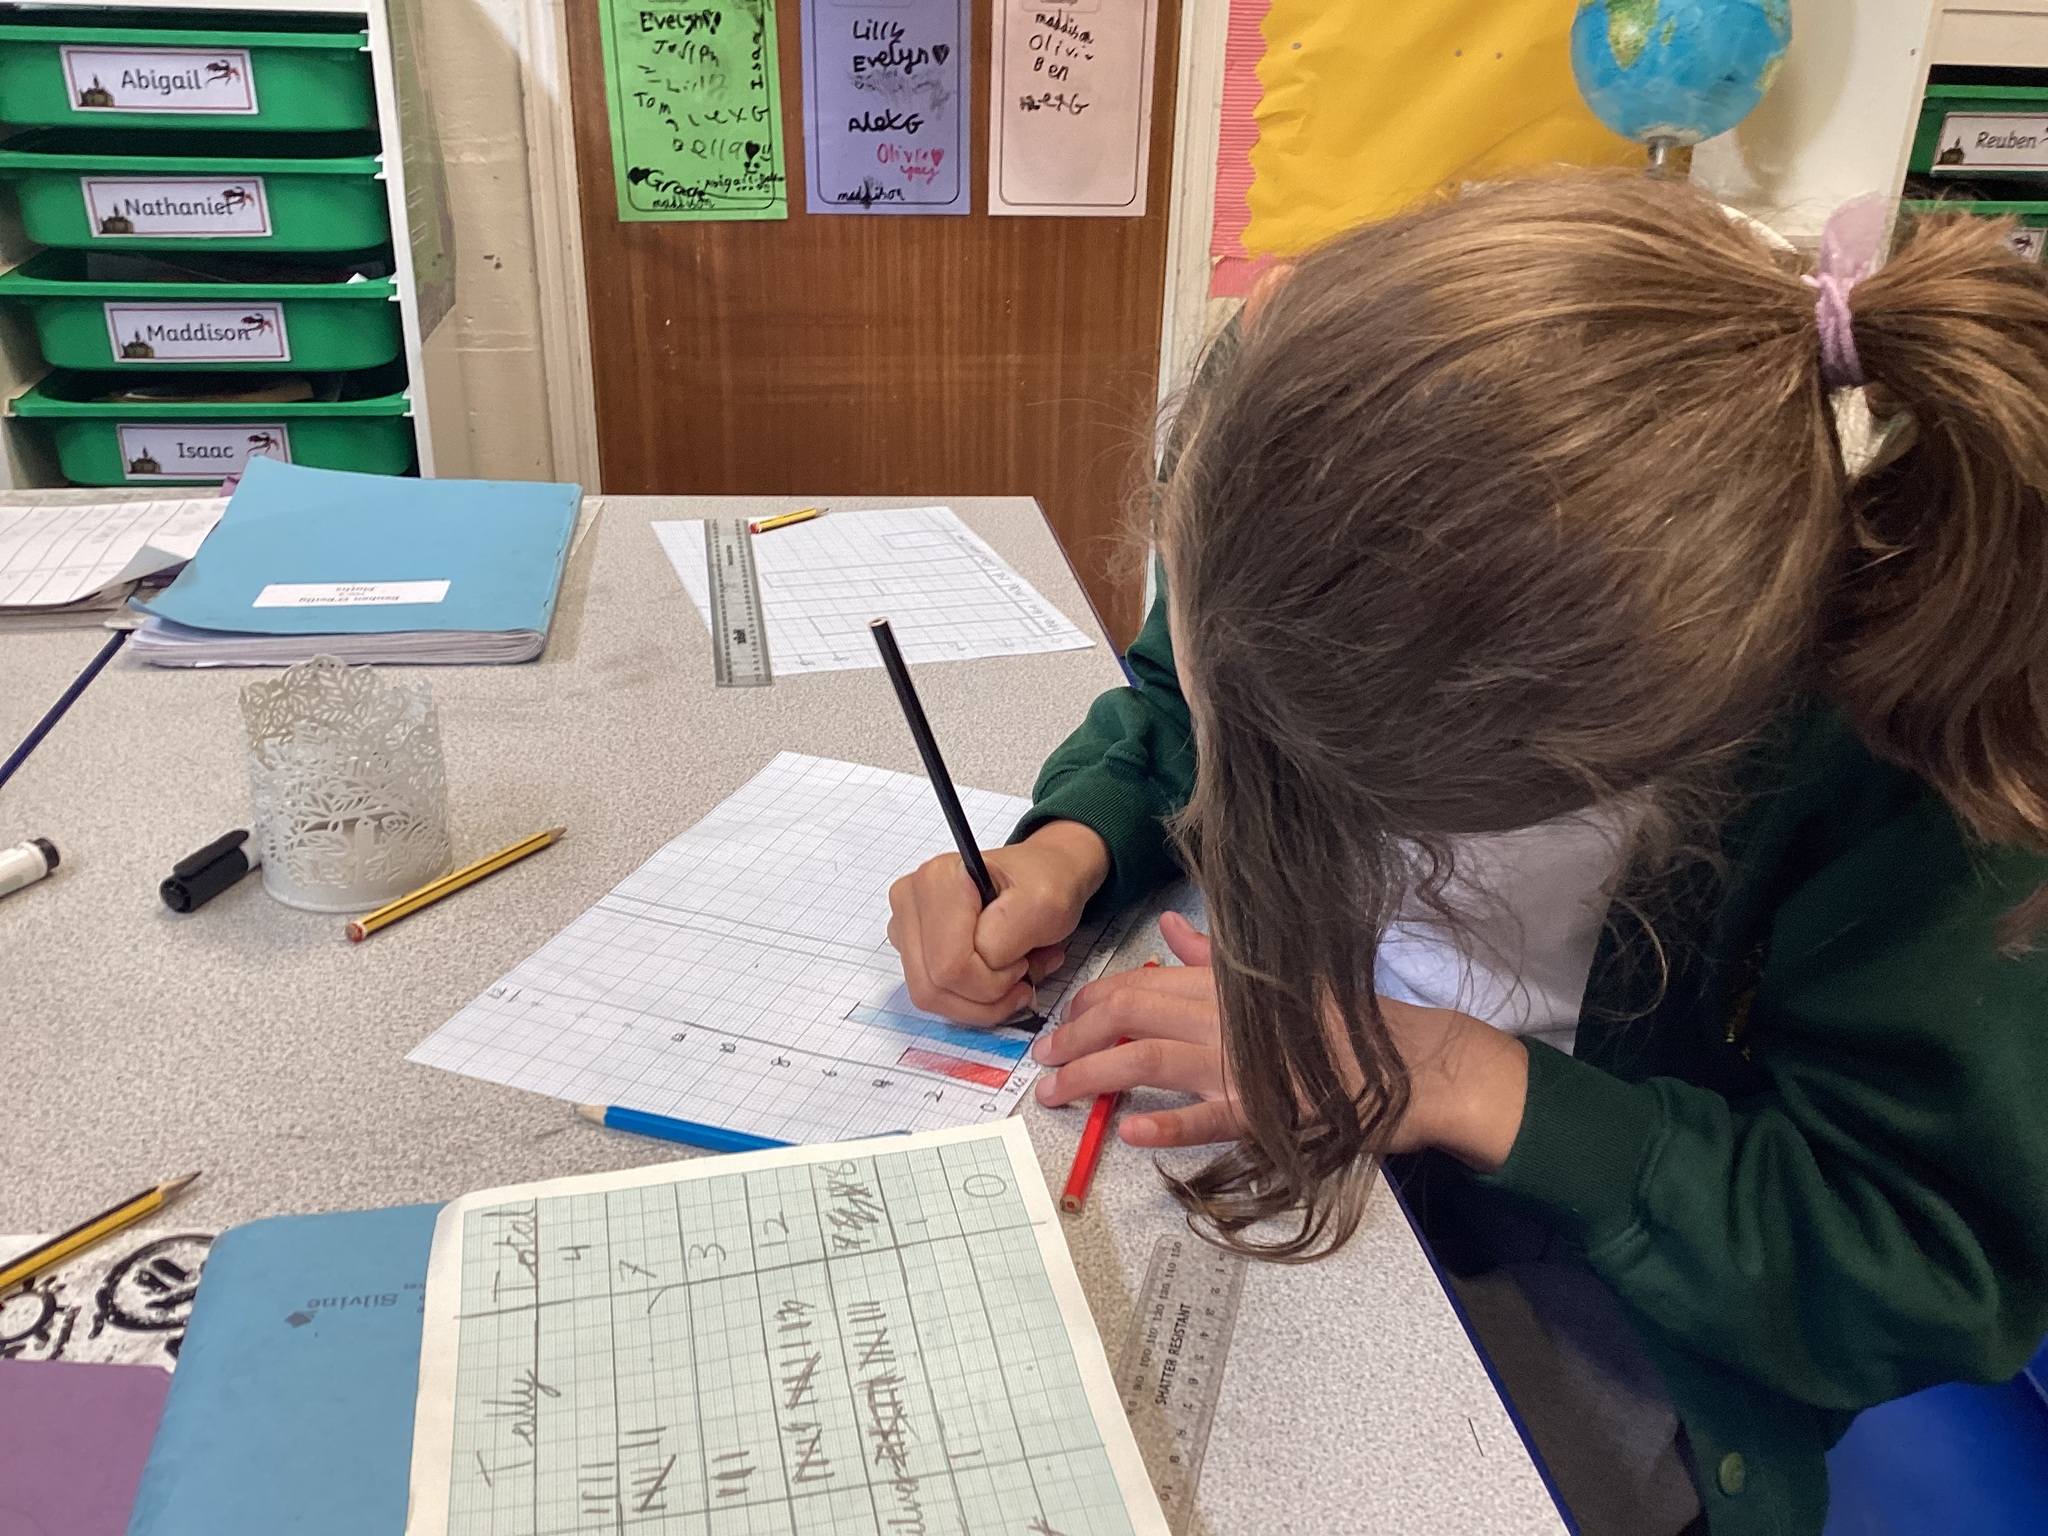
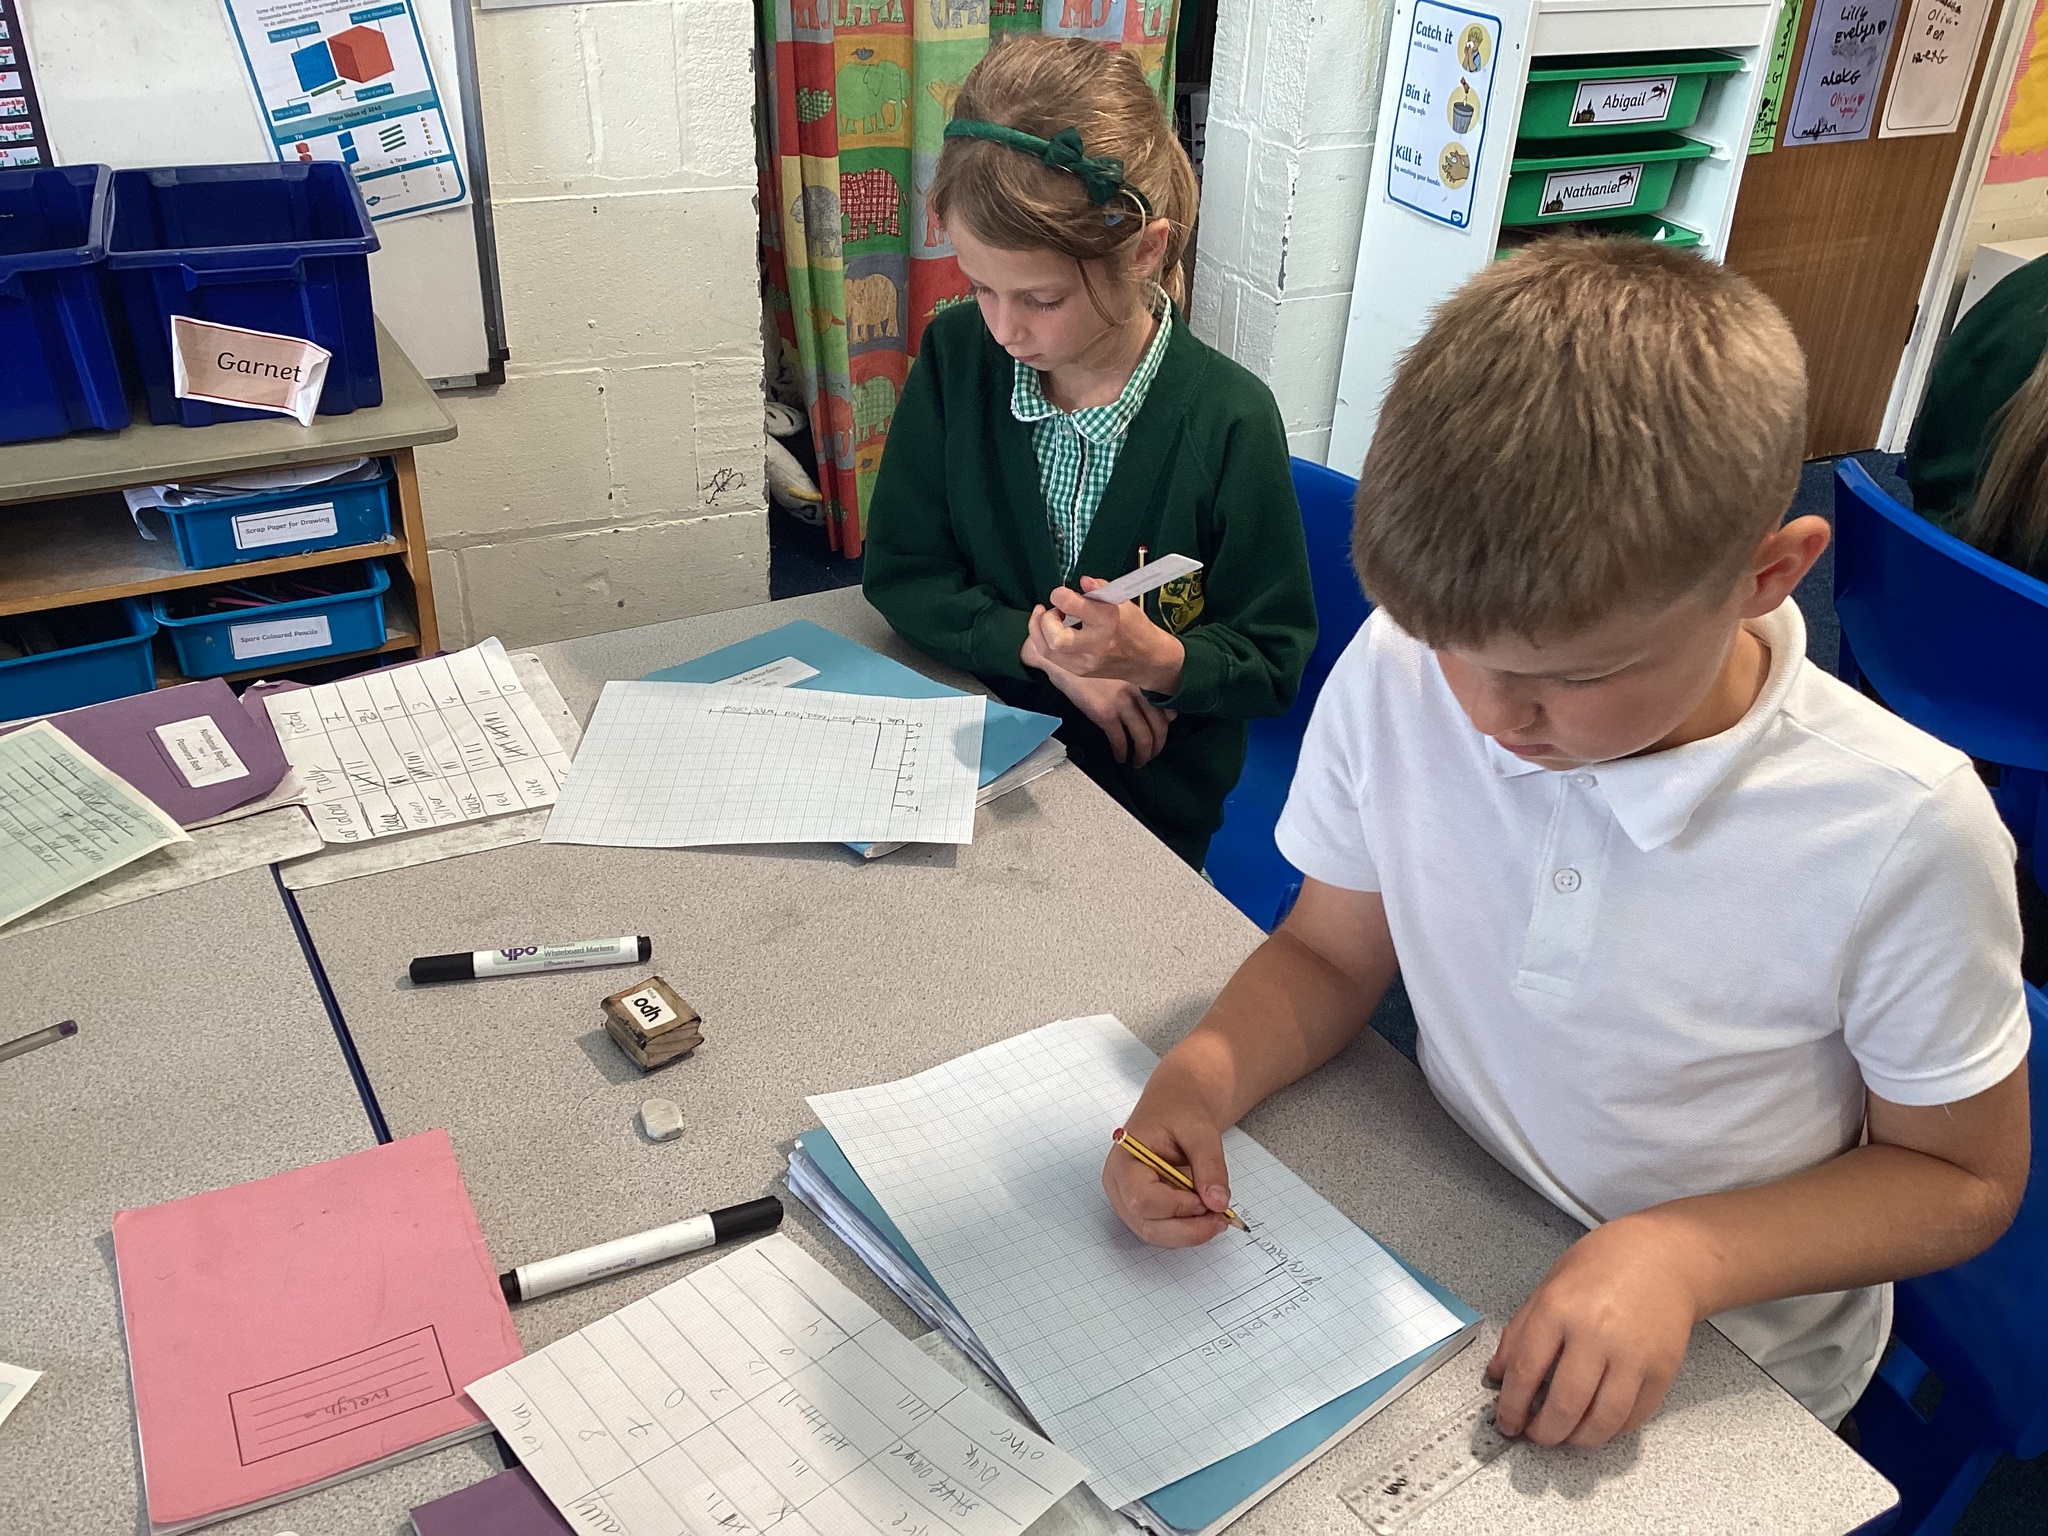
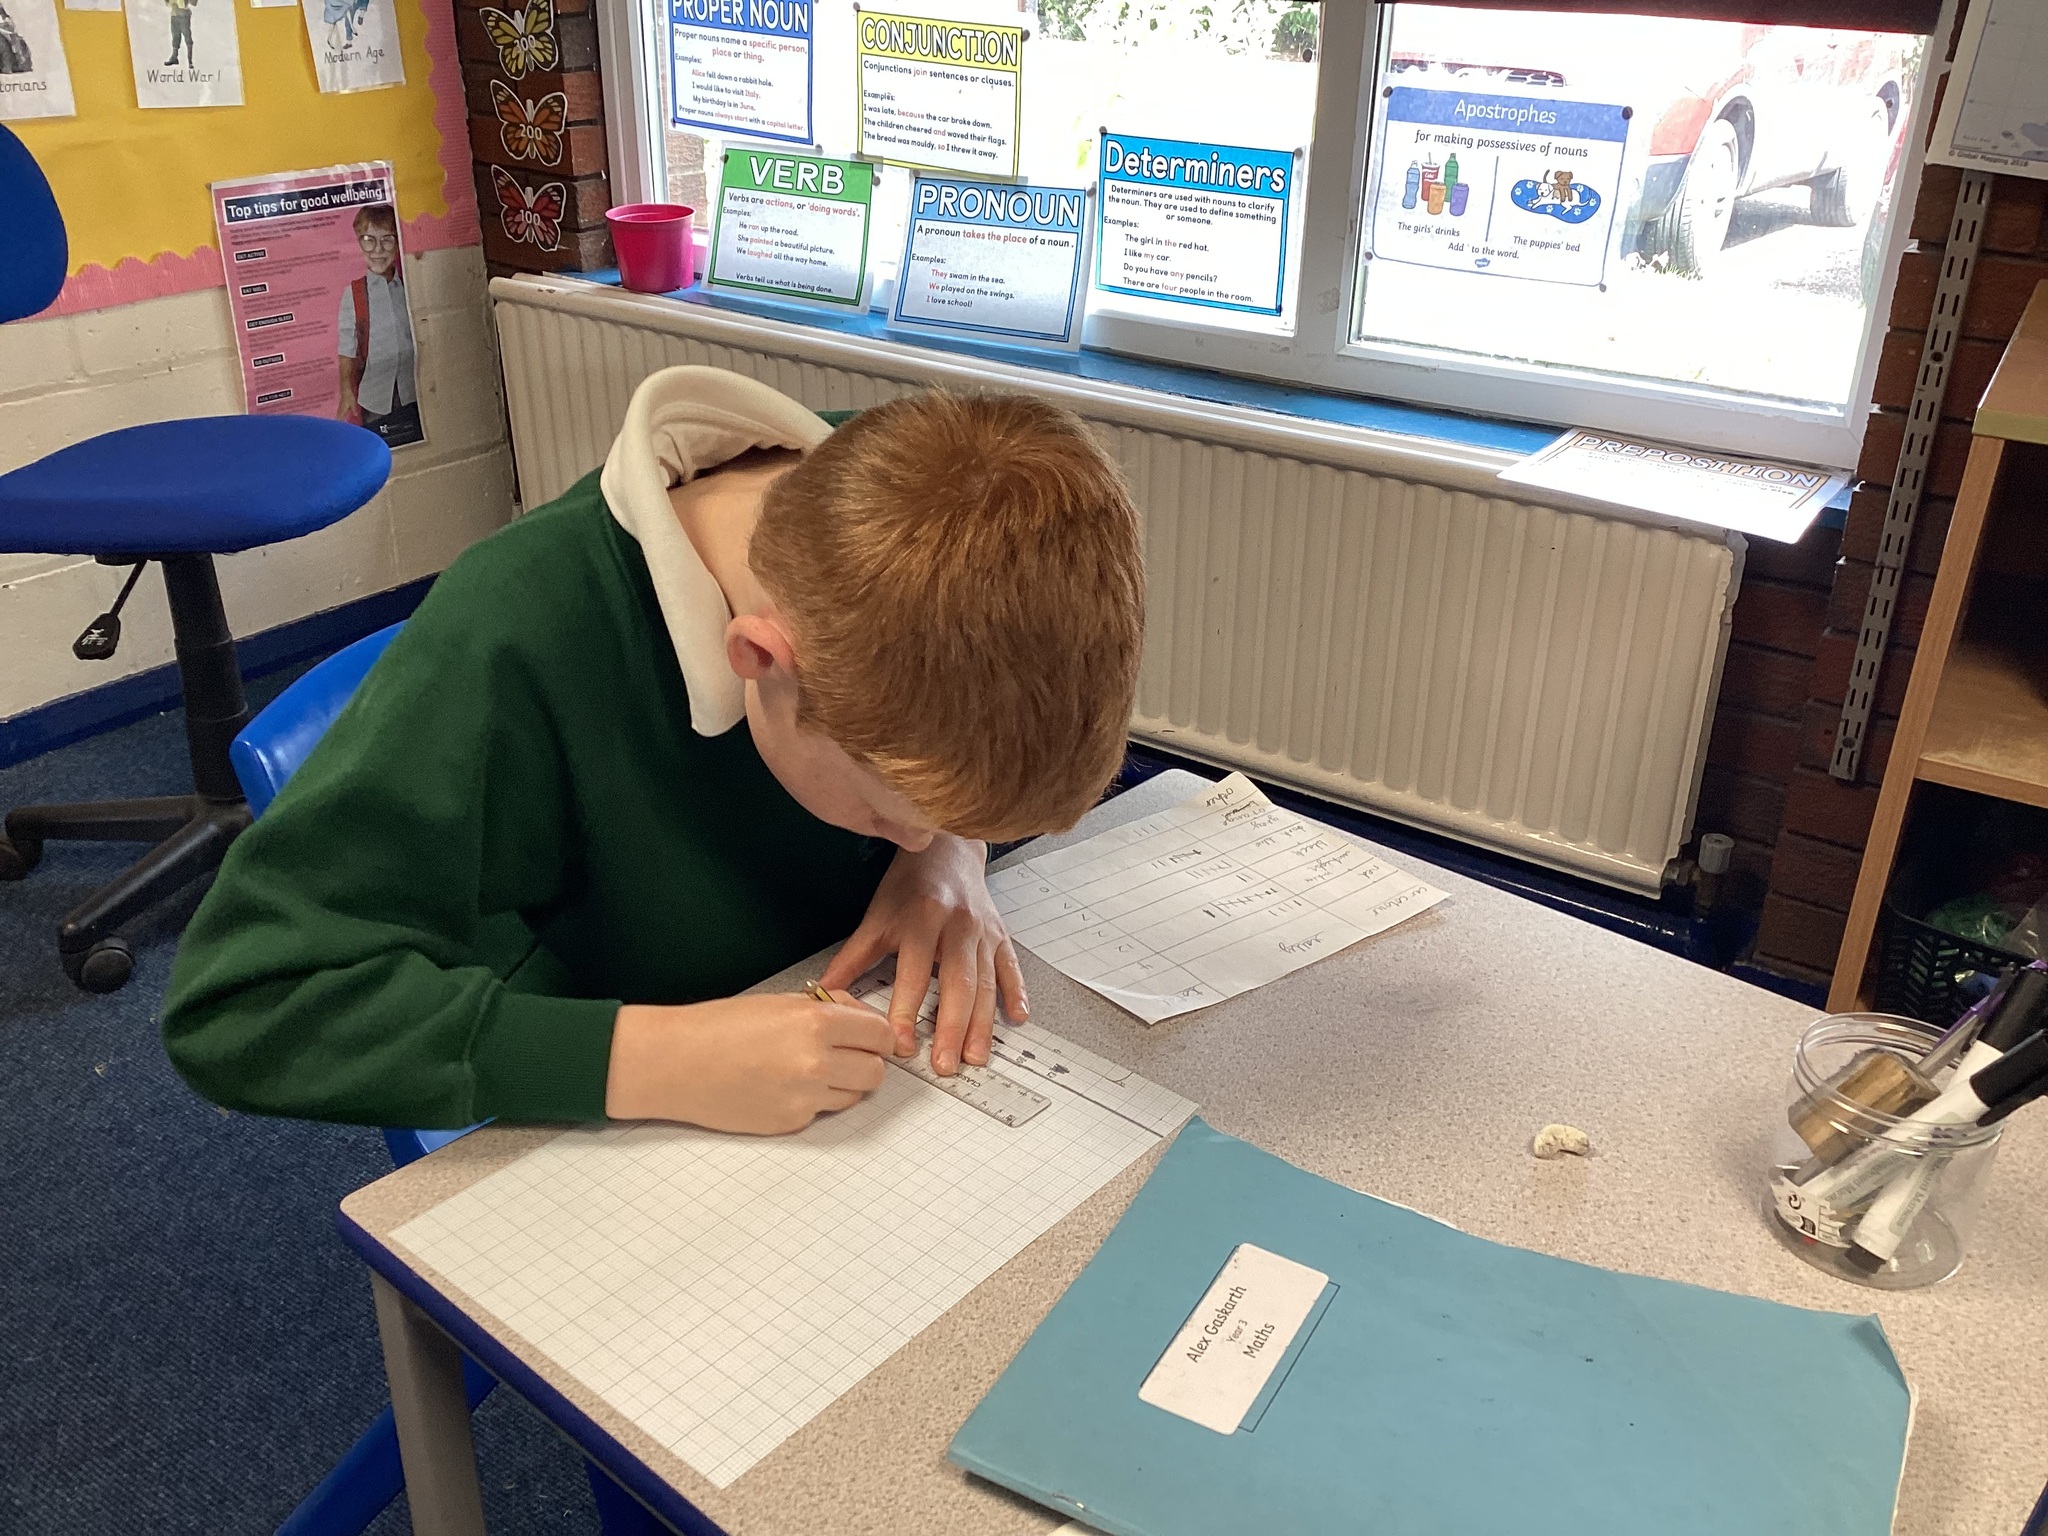
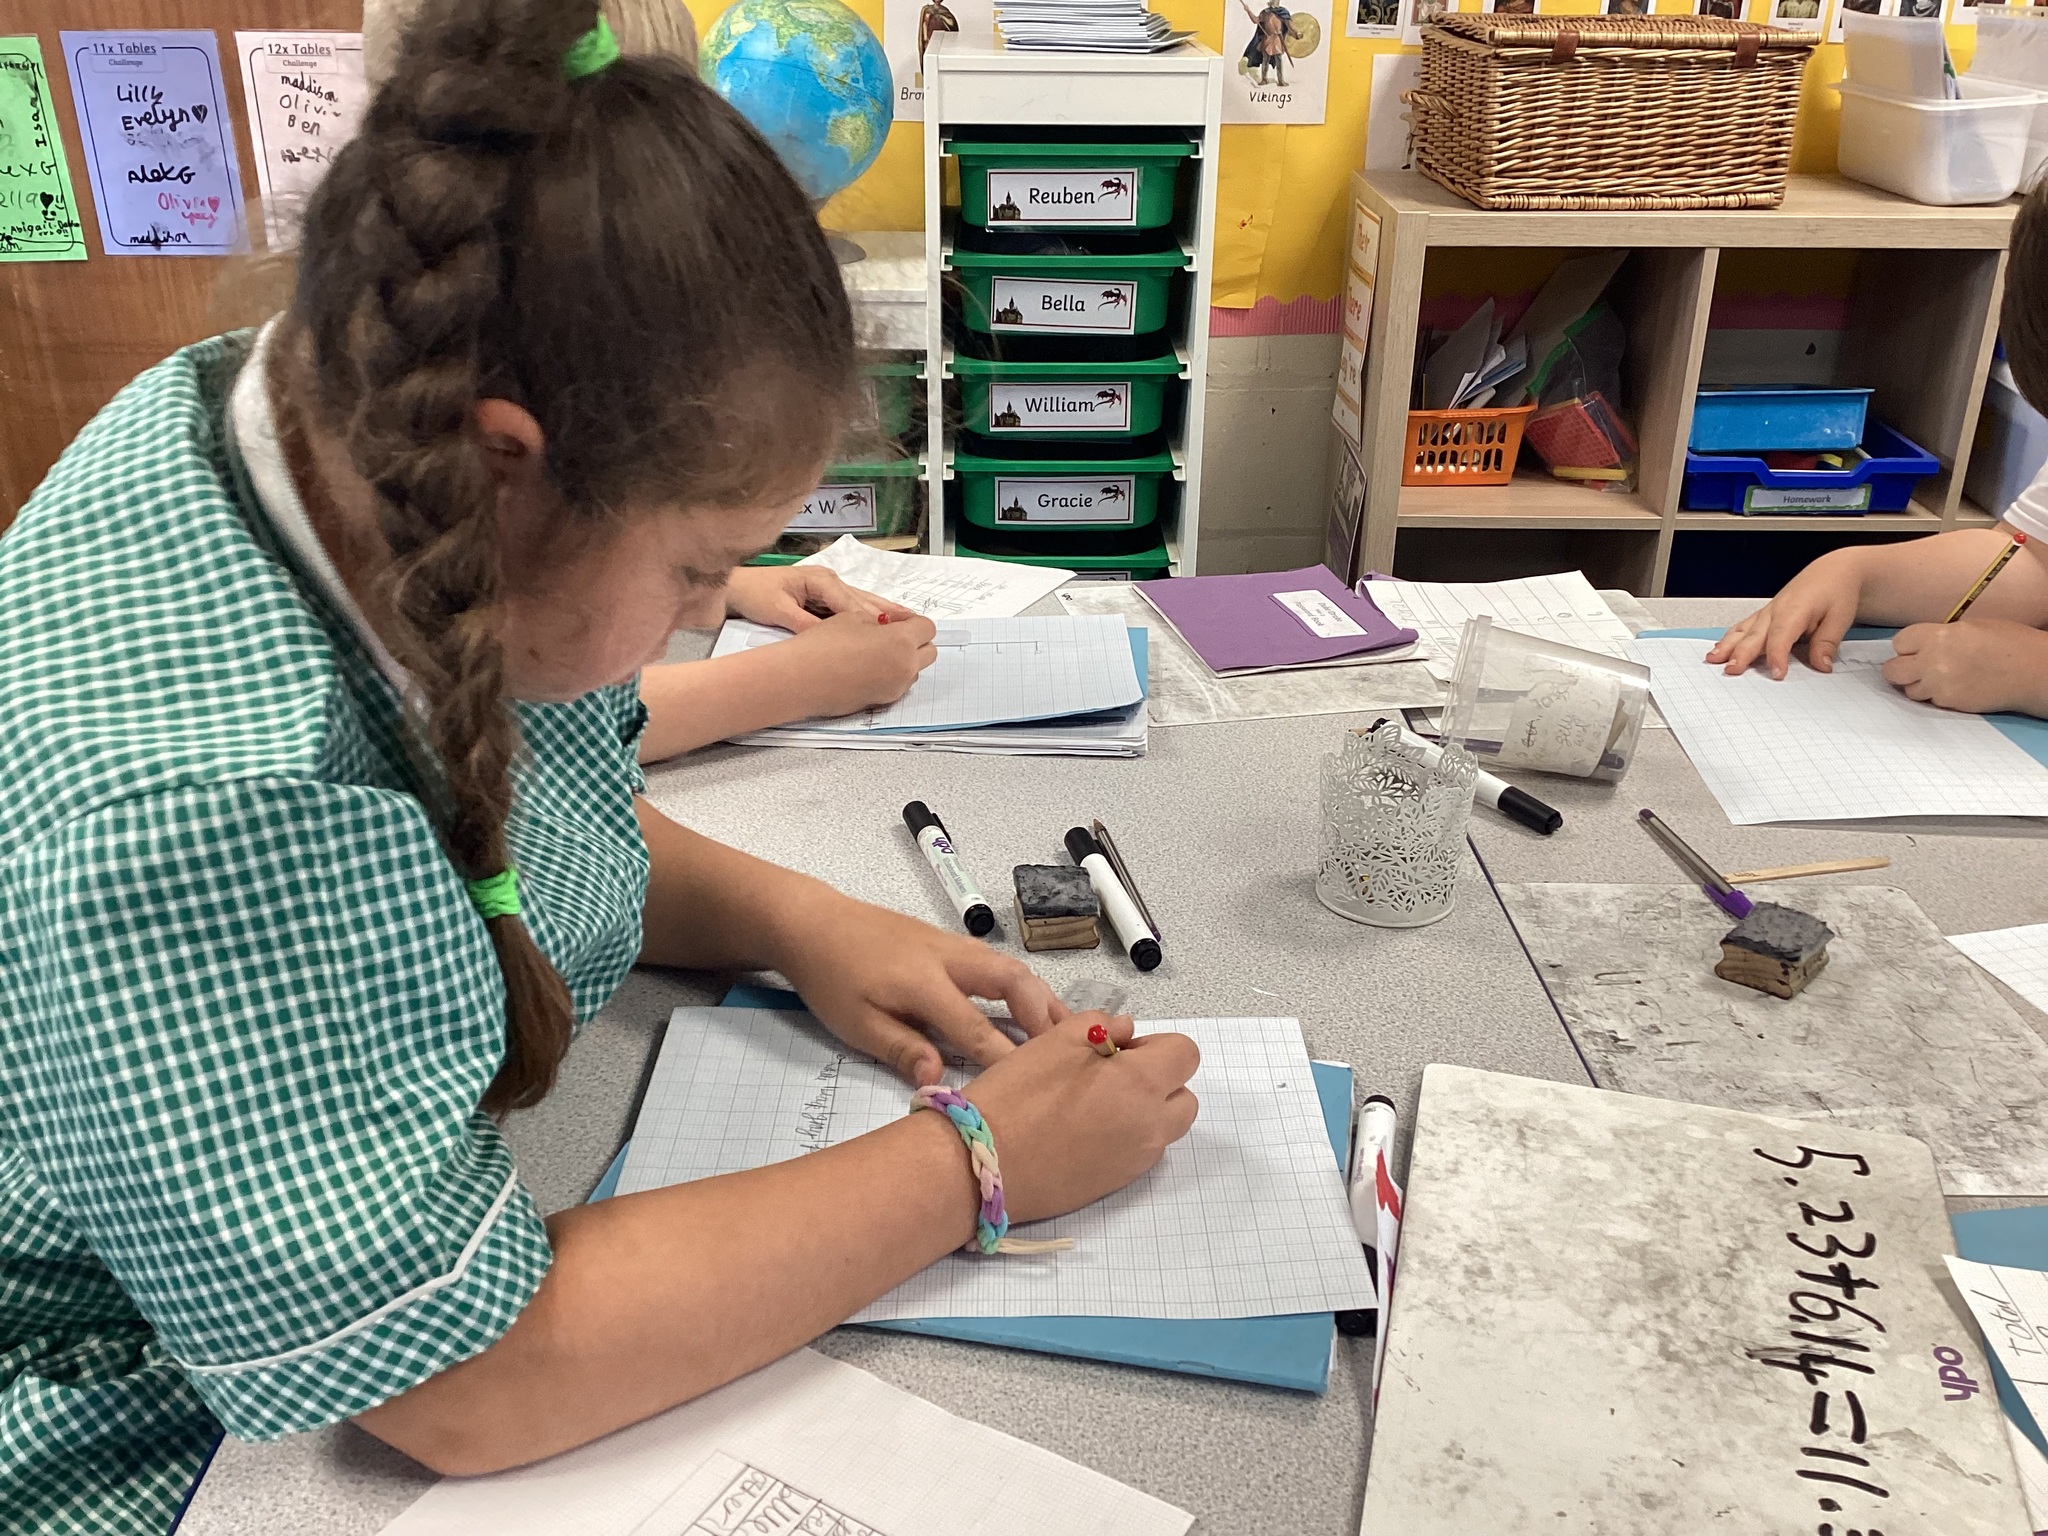
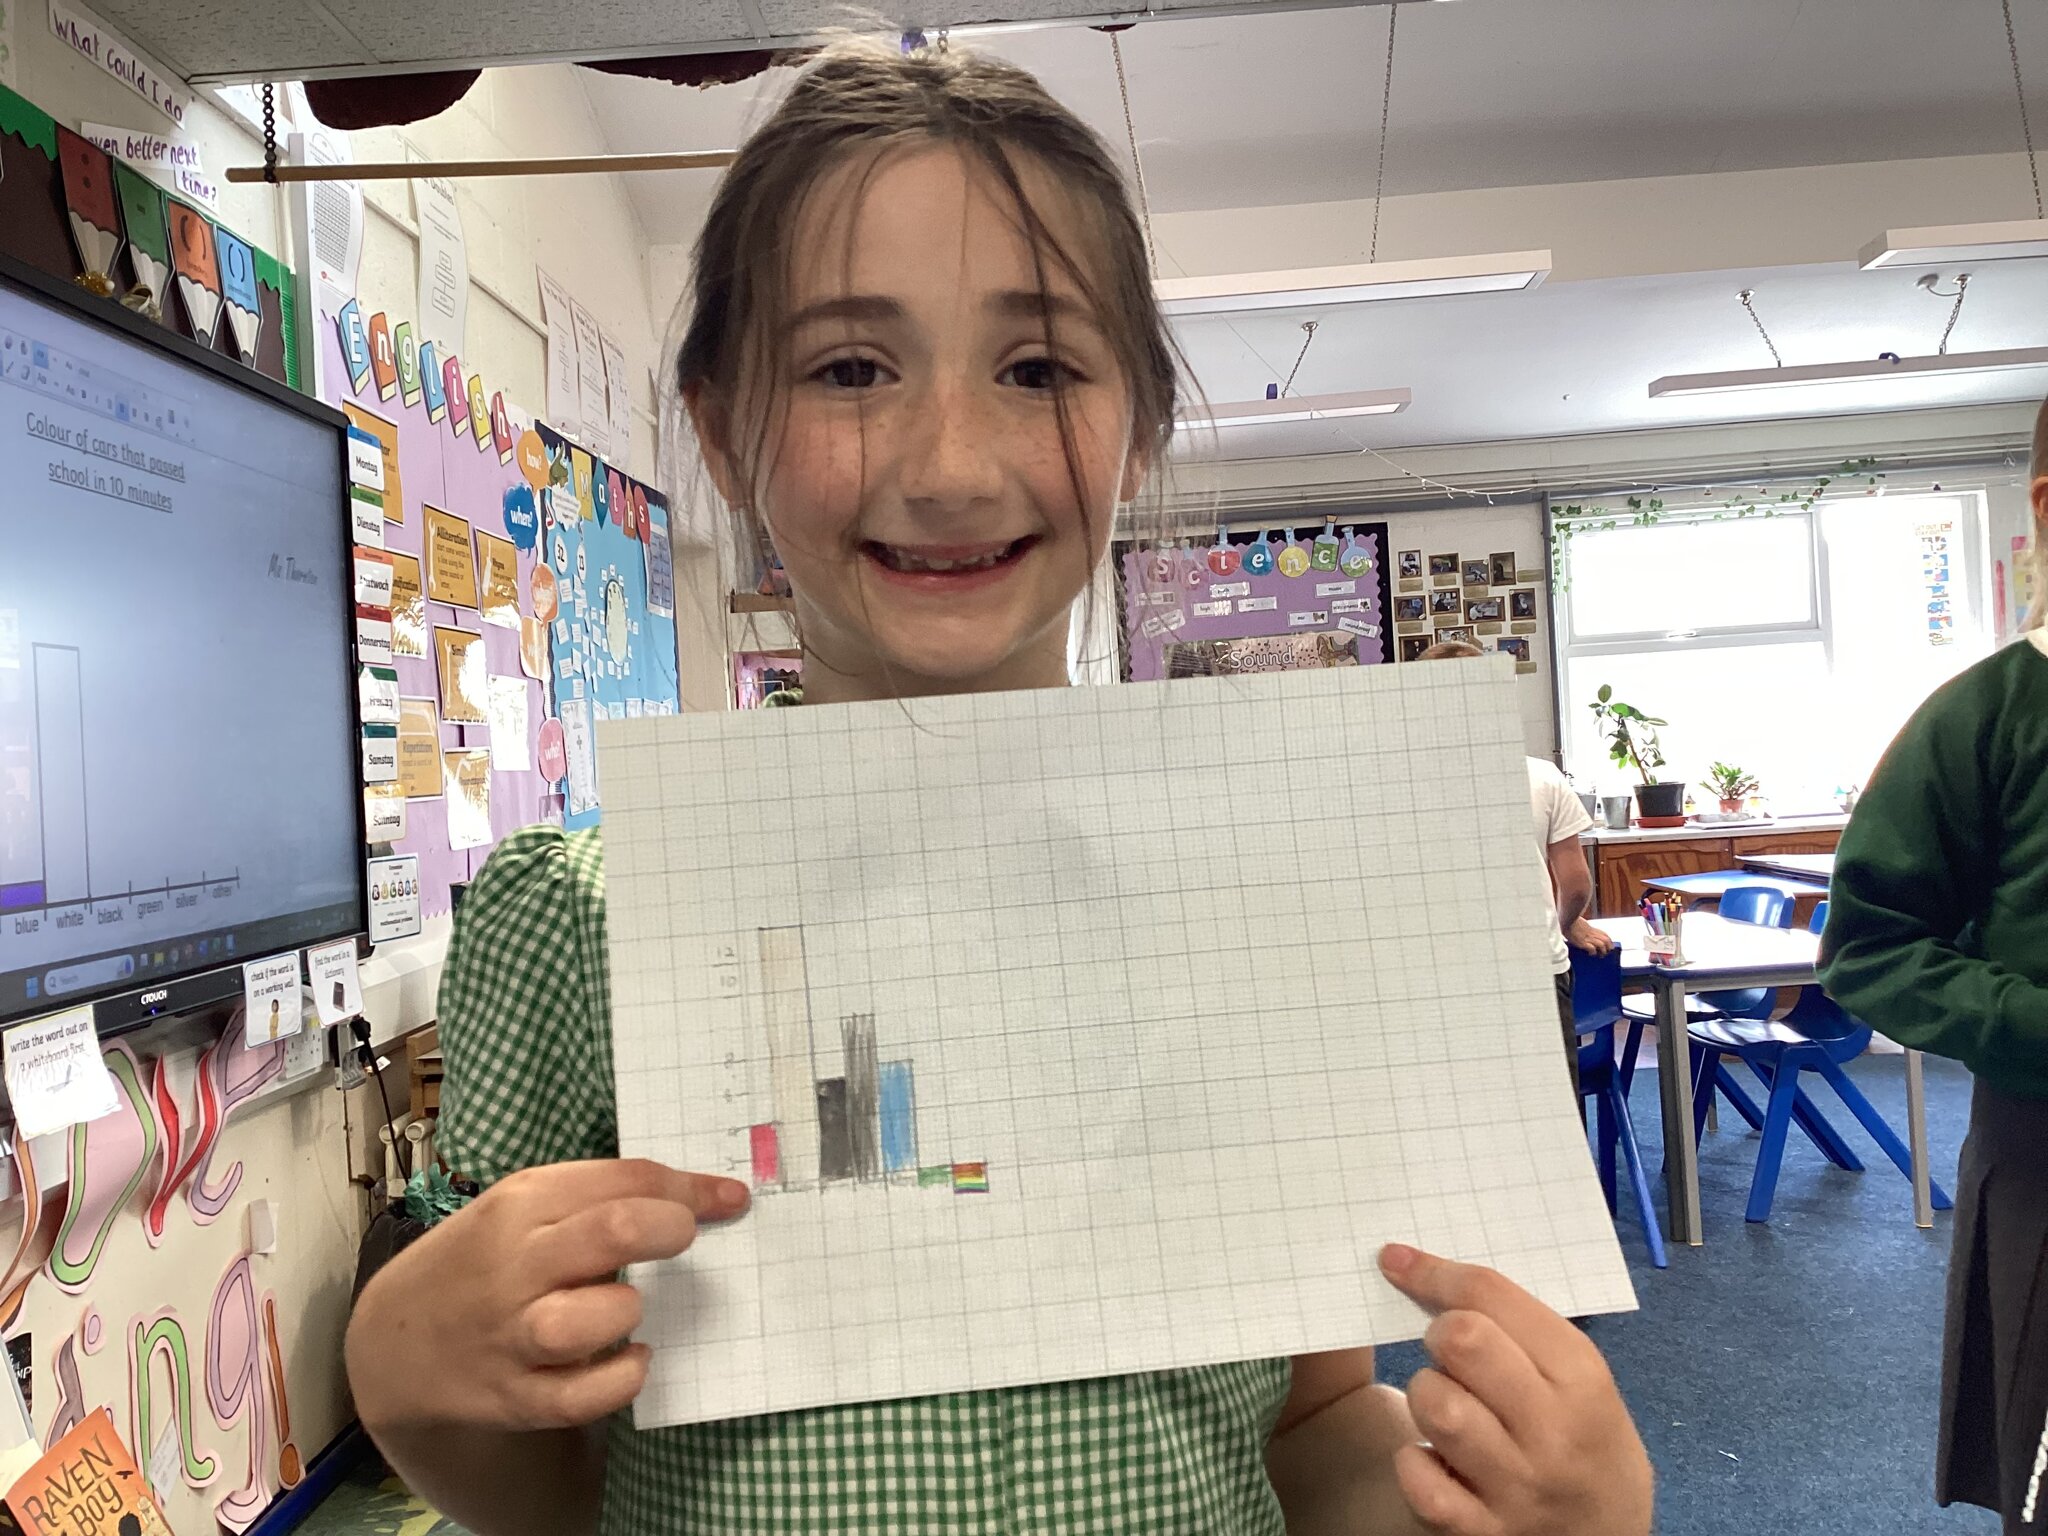
Once we had our tally charts ticked up, we headed inside the classroom again to create our bar charts.
Everyone did very well, remembering their x and y axis and labelling them correctly. Some children even got to colour their bars in to look extra lovely!
Well done middle school!
MSMAT050724